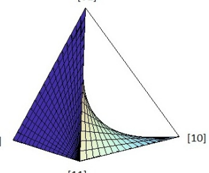
## 3D Pyramid Diagram: Labeled Geometric Structure
### Overview
The image depicts a 3D pyramid with a grid pattern, divided into two distinct sections: a **blue-shaded left face** and a **white-shaded right face** with a gradient transition from dark blue to light blue. The pyramid has three visible triangular faces, with labels [A], [10], and [11] positioned at specific vertices. The grid lines are black, and the diagram uses a wireframe-style representation.
### Components/Axes
- **Labels**:
- **[A]**: Positioned at the apex (top vertex) of the pyramid.
- **[10]**: Located at the bottom-right vertex of the base.
- **[11]**: Positioned at the bottom-left vertex of the base.
- **Color Coding**:
- **Blue**: Left triangular face (shaded uniformly).
- **White**: Right triangular face (with a gradient from dark blue to light blue).
- **Grid Lines**: Black lines forming a grid pattern across the pyramid’s surfaces, suggesting a coordinate or measurement system.
### Detailed Analysis
- **Label Placement**:
- **[A]** is centered at the top vertex, directly above the base.
- **[10]** and **[11]** are placed at the base vertices, with **[10]** on the right and **[11]** on the left.
- **Gradient Transition**: The right face (white) shows a smooth gradient from dark blue (near the apex) to light blue (near the base), indicating a potential variable (e.g., temperature, pressure, or material property) changing along the face.
- **Grid Pattern**: The grid lines are evenly spaced, suggesting a structured coordinate system (e.g., x, y, z axes) for spatial analysis.
### Key Observations
1. The pyramid is divided into two distinct regions (blue and white), possibly representing different materials, states, or zones.
2. The gradient on the right face implies a continuous variation in a property, though no numerical scale is provided.
3. Labels [A], [10], and [11] are positioned at critical vertices, likely denoting specific points of interest (e.g., nodes, reference points).
### Interpretation
The diagram appears to represent a **3D geometric model** with labeled vertices and a gradient-based property distribution. The blue and white sections may symbolize contrasting conditions (e.g., solid vs. fluid, high vs. low values). The grid lines suggest the pyramid is part of a larger coordinate system, potentially for engineering, architectural, or scientific analysis. The absence of numerical data or explicit units leaves the gradient’s exact meaning ambiguous, but its visual progression implies a measurable variable. The labels [A], [10], and [11] could correspond to nodes in a network, reference points in a simulation, or identifiers for further analysis.