# Technical Document Extraction: Refusal Ratio Analysis
## 1. Image Overview
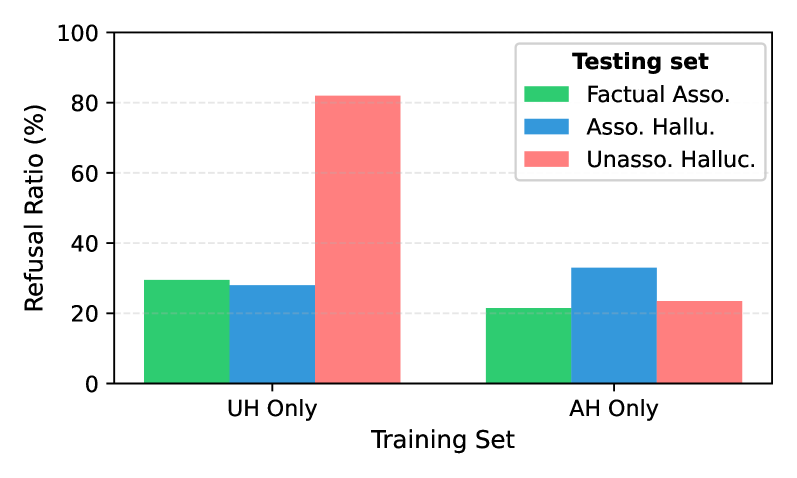
This image is a grouped bar chart illustrating the "Refusal Ratio (%)" of a model across different testing scenarios based on two distinct training configurations. The chart compares how training on specific types of data (UH vs. AH) affects the model's tendency to refuse to answer factual associations versus different types of hallucinations.
## 2. Component Isolation
### A. Header / Legend
* **Location:** Top right quadrant of the chart area.
* **Legend Title:** **Testing set**
* **Categories & Color Mapping:**
* **Factual Asso.** (Green): Represents factual association testing.
* **Asso. Hallu.** (Blue): Represents associative hallucination testing.
* **Unasso. Halluc.** (Light Red/Pink): Represents unassociated hallucination testing.
### B. Axis Definitions
* **Y-Axis (Vertical):**
* **Label:** Refusal Ratio (%)
* **Scale:** 0 to 100
* **Markers:** 0, 20, 40, 60, 80, 100
* **Gridlines:** Horizontal dashed light-gray lines at every 20% interval.
* **X-Axis (Horizontal):**
* **Label:** Training Set
* **Categories:** "UH Only" and "AH Only"
## 3. Data Extraction & Trend Verification
### Training Set: UH Only
* **Trend:** In this group, the model shows a significantly higher refusal rate for unassociated hallucinations compared to factual associations or associative hallucinations.
* **Data Points:**
* **Factual Asso. (Green):** ~30%
* **Asso. Hallu. (Blue):** ~28%
* **Unasso. Halluc. (Red):** ~82%
### Training Set: AH Only
* **Trend:** In this group, the refusal rates are much more balanced and lower overall. The model is most likely to refuse associative hallucinations, while the refusal rate for unassociated hallucinations drops drastically compared to the "UH Only" training set.
* **Data Points:**
* **Factual Asso. (Green):** ~22%
* **Asso. Hallu. (Blue):** ~33%
* **Unasso. Halluc. (Red):** ~24%
## 4. Data Table Reconstruction
| Training Set | Factual Asso. (Green) | Asso. Hallu. (Blue) | Unasso. Halluc. (Red) |
| :--- | :---: | :---: | :---: |
| **UH Only** | ~30% | ~28% | ~82% |
| **AH Only** | ~22% | ~33% | ~24% |
## 5. Key Observations & Technical Summary
* **Impact of UH Training:** Training exclusively on "UH" (likely Unassociated Hallucinations) leads to a very high refusal rate (~82%) when encountering unassociated hallucinations in testing, but it does not effectively prepare the model to refuse associative hallucinations (~28%).
* **Impact of AH Training:** Training exclusively on "AH" (likely Associative Hallucinations) results in a more uniform refusal profile. While it increases the refusal of associative hallucinations (~33%), it significantly reduces the refusal rate for unassociated hallucinations (~24%) compared to the UH training method.
* **Factual Refusal:** Both training methods result in a baseline refusal of factual associations between 20% and 30%, with "AH Only" training showing a slightly lower (better) refusal rate for factual information.