## System Diagram: Visual-to-Binaural Audio Conversion
### Overview
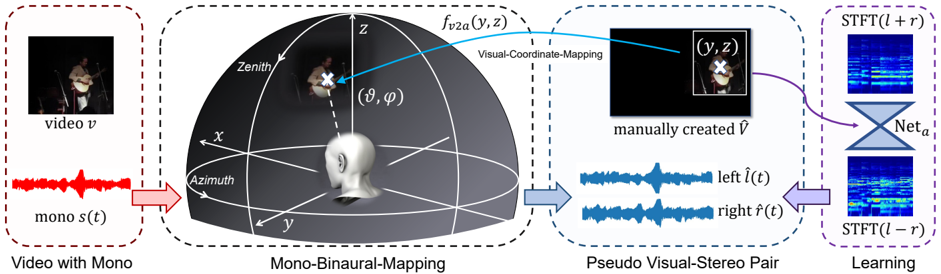
The image is a system diagram illustrating a process for converting a monaural audio track from a video into a pseudo-stereo binaural audio representation using visual information. The diagram shows the flow of data from a video with mono audio, through a mono-binaural mapping stage, to a pseudo visual-stereo pair, and finally to a learning stage.
### Components/Axes
* **Video with Mono (Leftmost Block):**
* Contains a video frame labeled "video v".
* Contains a waveform labeled "mono s(t)".
* Overall label: "Video with Mono".
* **Mono-Binaural-Mapping (Center-Left Block):**
* A 3D coordinate system with axes labeled "x", "y", and "z".
* Labels "Zenith" and "Azimuth" are shown.
* A head model is positioned at the origin.
* A video frame is projected onto a hemisphere, with a location marked with a white "X".
* The location is described by spherical coordinates "(θ, φ)".
* A blue arrow labeled "f\_v2a(y, z)" points from the hemisphere to the next block.
* Overall label: "Mono-Binaural-Mapping".
* **Pseudo Visual-Stereo Pair (Center-Right Block):**
* A video frame with a white bounding box and a white "X" marking a location, labeled "(y, z)".
* Text: "manually created V"
* Two waveforms, labeled "left l^(t)" and "right r^(t)".
* Overall label: "Pseudo Visual-Stereo Pair".
* **Learning (Rightmost Block):**
* Two spectrograms, labeled "STFT(l + r)" and "STFT(l - r)".
* A hourglass-shaped diagram labeled "Net\_a" connects the two spectrograms.
* Overall label: "Learning".
### Detailed Analysis or ### Content Details
* **Video with Mono:** The diagram starts with a video and its corresponding monaural audio signal. The video frame shows a person playing a guitar. The audio waveform is a time-domain representation of the monaural audio.
* **Mono-Binaural-Mapping:** This stage maps the visual information (location of the sound source in the video frame) to a 3D spatial location relative to a listener's head. The hemisphere represents the possible locations of sound sources. The "Zenith" and "Azimuth" labels indicate the coordinate system used.
* **Pseudo Visual-Stereo Pair:** Based on the spatial location, a pseudo-stereo pair of audio signals is generated. These signals, "left l^(t)" and "right r^(t)", represent the audio that would be heard by the left and right ears, respectively, if the sound source were located at the specified spatial location.
* **Learning:** The pseudo-stereo audio signals are transformed into spectrograms using the Short-Time Fourier Transform (STFT). These spectrograms, "STFT(l + r)" and "STFT(l - r)", represent the frequency content of the audio signals over time. A neural network, "Net\_a", is used to learn the mapping between the visual information and the binaural audio representation.
### Key Observations
* The diagram illustrates a system for creating binaural audio from monaural audio using visual information.
* The system involves mapping visual locations to 3D spatial locations, generating pseudo-stereo audio signals, and using a neural network to learn the mapping.
* The use of spectrograms allows the neural network to learn the frequency-domain characteristics of the audio signals.
### Interpretation
The diagram presents a method for synthesizing binaural audio from monaural audio by leveraging visual cues. The core idea is that the visual location of a sound source in a video can be used to estimate the spatial location of the sound, which in turn can be used to generate a pseudo-stereo audio signal that simulates how the sound would be heard by a listener. The neural network "Net\_a" likely learns to refine this mapping, potentially compensating for inaccuracies in the initial visual-to-spatial mapping or capturing more complex relationships between visual and auditory information. This approach could be used to enhance the realism of virtual reality or augmented reality experiences, or to improve the accessibility of audio content for people with hearing impairments.