## Diagram: Audio-Visual Processing Pipeline with Spatial Mapping and Learning
### Overview
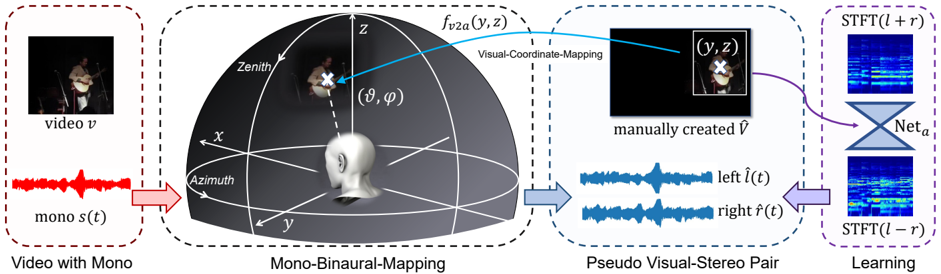
The diagram illustrates a technical pipeline for processing audio-visual data, integrating spatial coordinate mapping, pseudo stereo pair generation, and machine learning. It connects four primary components:
1. **Video with Mono** (input)
2. **Mono-Binaural-Mapping** (spatial transformation)
3. **Pseudo Visual-Stereo Pair** (audio-visual synthesis)
4. **Learning** (neural network refinement)
### Components/Axes
#### 1. Video with Mono
- **Visual Input**: Labeled "video v" (top-left corner).
- **Audio Input**: Red waveform labeled "mono s(t)" (bottom-left corner).
- **Spatial Coordinates**:
- 3D coordinate system with axes labeled **X**, **Y**, **Z**.
- **Zenith** (top of Z-axis), **Azimuth** (horizontal plane).
- Angles **θ** (polar angle) and **φ** (azimuthal angle) marked near a 3D head model.
#### 2. Mono-Binaural-Mapping
- **Visual-Coordinate-Mapping**: Blue arrow labeled **f<sub>v2a</sub>(y,z)** connects the 3D head model to a pseudo stereo pair.
- **Manually Created Visual**: Labeled **Ṽ** (black square with crosshair).
#### 3. Pseudo Visual-Stereo Pair
- **Left Audio**: Blue waveform labeled **left l̂(t)**.
- **Right Audio**: Blue waveform labeled **right r̂(t)**.
- **Visual Output**: Black square with crosshair (mirroring the manually created **Ṽ**).
#### 4. Learning
- **STFT Visualizations**:
- **STFT(l + r)**: Blue spectrogram (top-right).
- **STFT(l - r)**: Blue spectrogram (bottom-right).
- **Neural Network**: Labeled **Net<sub>a</sub>** (gray diamond connecting STFT outputs).
### Detailed Analysis
- **Spatial Mapping**: The 3D coordinate system (X, Y, Z) defines a spherical coordinate framework for mapping audio-visual relationships. The head model anchors the origin, with **θ** and **φ** defining directional vectors.
- **Pseudo Stereo Generation**: The left/right audio waveforms (**l̂(t)**, **r̂(t)**) are derived from the mono input **s(t)** via coordinate transformations.
- **Learning Phase**: The STFT visualizations (**STFT(l + r)**, **STFT(l - r)**) represent frequency-domain analysis of the synthesized stereo pair, refined by **Net<sub>a</sub>**.
### Key Observations
- **Color Coding**:
- Red: Mono audio (**s(t)**).
- Blue: Pseudo stereo audio and STFT outputs.
- Purple: Learning phase (STFT and network).
- **Flow Direction**: Arrows indicate sequential processing from input (video/audio) to spatial mapping, stereo synthesis, and finally learning.
- **Missing Elements**: No explicit numerical values or data tables; the diagram focuses on conceptual relationships.
### Interpretation
This pipeline demonstrates a method for enhancing mono audio-visual data by:
1. Mapping spatial coordinates to simulate binaural hearing.
2. Generating pseudo stereo pairs to enrich audio depth.
3. Using STFT and neural networks to refine frequency-domain representations.
The absence of numerical data suggests the diagram emphasizes architectural design over empirical results. The use of **Net<sub>a</sub>** implies a focus on adaptive learning for audio-visual synchronization. The crosshair in **Ṽ** may indicate a focal point for coordinate alignment, critical for accurate spatial mapping.