\n
## Diagram: LLM with Uncertainty Estimation
### Overview
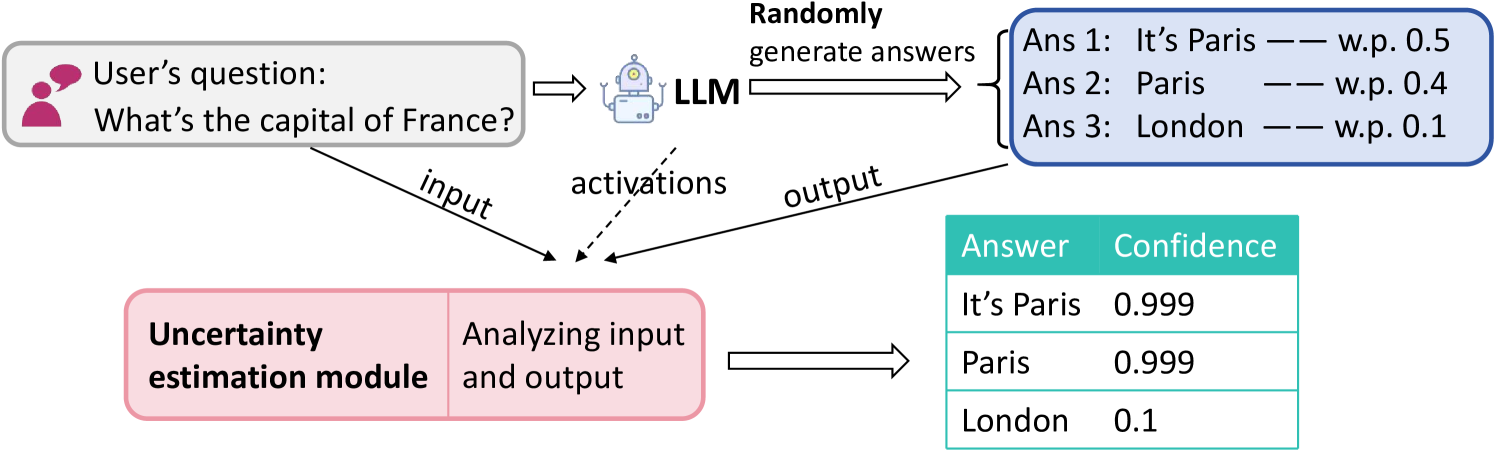
This diagram illustrates a system where a Large Language Model (LLM) generates multiple answers to a user's question, and an "Uncertainty Estimation Module" analyzes both the input and output to provide confidence scores for each answer. The diagram depicts the flow of information from the user question, through the LLM, and finally to the uncertainty estimation module, culminating in a ranked list of answers with associated confidence levels.
### Components/Axes
The diagram consists of the following components:
* **User Question:** Represented by a speech bubble containing the text "What's the capital of France?".
* **LLM (Large Language Model):** A stylized computer icon labeled "LLM".
* **Randomly generate answers:** A box indicating the LLM's output process.
* **Uncertainty estimation module:** A pink rectangular box labeled "Uncertainty estimation module".
* **Arrows:** Indicate the flow of information. Labels on the arrows include "input", "activations", "output".
* **Answer/Confidence Table:** A table with two columns: "Answer" and "Confidence".
### Detailed Analysis or Content Details
The diagram shows the following data flow:
1. **User Question:** The question "What's the capital of France?" is presented as input.
2. **LLM Generation:** The LLM generates three potential answers:
* Ans 1: "It's Paris" with a weight (w.p.) of 0.5
* Ans 2: "Paris" with a weight (w.p.) of 0.4
* Ans 3: "London" with a weight (w.p.) of 0.1
3. **Uncertainty Estimation:** The "Uncertainty estimation module" analyzes the input question and the LLM's output.
4. **Answer/Confidence Table:** The module outputs the following confidence scores:
* "It's Paris": 0.999
* "Paris": 0.999
* "London": 0.1
The arrows indicate the following:
* The user question flows into the LLM as "input".
* "Activations" flow from the LLM to the Uncertainty estimation module.
* "Output" flows from the LLM to the Randomly generate answers box.
* The Uncertainty estimation module then outputs the final answers and confidence scores.
### Key Observations
The LLM initially assigns probabilities to each answer (0.5, 0.4, 0.1). The Uncertainty Estimation Module significantly refines these probabilities, assigning very high confidence (0.999) to "It's Paris" and "Paris", and very low confidence (0.1) to "London". This suggests the module is able to effectively identify the correct answer and quantify its certainty.
### Interpretation
This diagram demonstrates a system for improving the reliability of LLM outputs by incorporating an uncertainty estimation module. The LLM generates a range of possible answers, reflecting its inherent uncertainty. The uncertainty estimation module then analyzes this output, along with the input question, to provide a more accurate assessment of the confidence level for each answer. This is crucial for applications where incorrect answers could have significant consequences. The large difference between the initial probabilities assigned by the LLM and the final confidence scores calculated by the uncertainty estimation module highlights the value of this approach. The system effectively filters out incorrect answers ("London") and reinforces the correct ones ("Paris"). The diagram suggests a system designed to not only provide answers but also to *know* how confident it is in those answers.