## Diagram: LLM Uncertainty Estimation Process
### Overview
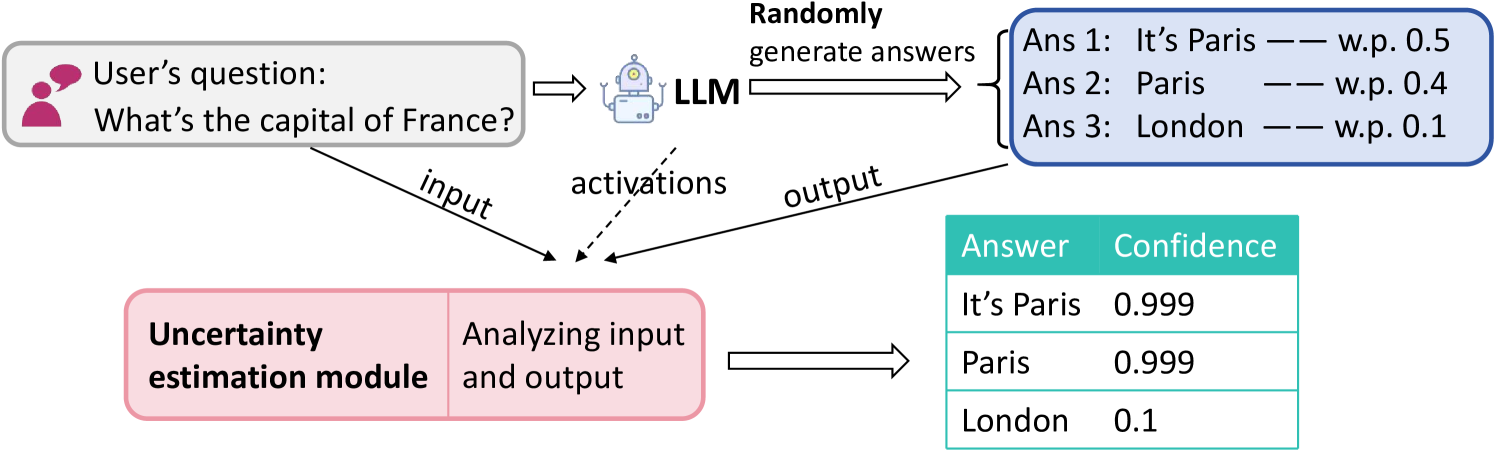
This diagram illustrates a process flow for estimating the uncertainty of answers generated by a Large Language Model (LLM). It shows how a user's question is processed by an LLM to generate multiple potential answers with associated probabilities, and how a separate "Uncertainty estimation module" analyzes the input, model activations, and output to assign a final confidence score to each answer.
### Components & Flow
The diagram is organized into three main horizontal sections, with arrows indicating the flow of information.
**1. Top Section (Input & Generation):**
* **Top-Left (Input):** A gray box with a pink user icon contains the text: `User's question: What's the capital of France?`.
* **Top-Center (Processing):** A robot icon labeled `LLM` receives the user's question via a right-pointing arrow.
* **Top-Right (Output):** A blue-bordered box titled `Randomly generate answers` contains a list of three potential answers with their generation probabilities:
* `Ans 1: It's Paris — w.p. 0.5`
* `Ans 2: Paris — w.p. 0.4`
* `Ans 3: London — w.p. 0.1`
* *Note: "w.p." is an abbreviation for "with probability".*
**2. Middle Section (Information Flow to Uncertainty Module):**
Three arrows point from the top section down to the "Uncertainty estimation module" in the bottom-left:
* An arrow labeled `input` originates from the user's question box.
* A dashed arrow labeled `activations` originates from the LLM icon.
* An arrow labeled `output` originates from the answer list box.
**3. Bottom Section (Analysis & Final Confidence):**
* **Bottom-Left (Analysis Module):** A pink box divided into two parts. The left part is labeled `Uncertainty estimation module`. The right part contains the text `Analyzing input and output`.
* **Bottom-Right (Result Table):** A right-pointing arrow from the analysis module leads to a table (with a teal header row) as follows:
| Answer | Confidence |
|--------|------------|
| It's Paris | 0.999 |
| Paris | 0.999 |
| London | 0.1 |
### Detailed Analysis
The process demonstrates a method for evaluating the reliability of LLM outputs. The LLM does not produce a single answer but a distribution of possible answers. For the factual question "What's the capital of France?", the model generates two correct variants ("It's Paris", "Paris") with high combined probability (0.9) and one incorrect answer ("London") with low probability (0.1).
The uncertainty estimation module takes three streams of data: the original input question, the internal model activations during generation, and the final output list. It processes this information to produce a final confidence score for each candidate answer.
### Key Observations
1. **Confidence vs. Probability:** The module's final confidence scores (0.999, 0.999, 0.1) are distinct from the LLM's generation probabilities (0.5, 0.4, 0.1). The module assigns near-perfect confidence to both correct answers, effectively merging their probabilities, while its confidence in the incorrect answer matches the LLM's low probability.
2. **Spatial Layout:** The legend (answer list with probabilities) is positioned in the top-right. The final output table is in the bottom-right. The core analysis module is in the bottom-left, acting as the central processing node.
3. **Color Coding:** The diagram uses color to group related elements: pink for user input and the analysis module, blue for the LLM's output space, and teal for the final confidence results.
### Interpretation
This diagram outlines a framework for making LLM outputs more trustworthy. It suggests that by analyzing not just the final text but also the input context and the model's internal state (activations), a separate system can better quantify how certain the model "should" be about its answers.
The key takeaway is the system's ability to distinguish between high-confidence correct answers and low-confidence incorrect ones. For the example question, it correctly identifies that "London" is an answer the LLM is uncertain about (confidence 0.1), while being very confident in the correct answers. This process is crucial for deploying LLMs in high-stakes domains where understanding the model's certainty is as important as the answer itself. The diagram implies that raw generation probability from the LLM may not be the best measure of final answer reliability, and a dedicated uncertainty estimation step provides a more calibrated confidence metric.