## Scatter Plot with Clusters: GSM8k, MATH, and OlympiadBench Datasets
### Overview
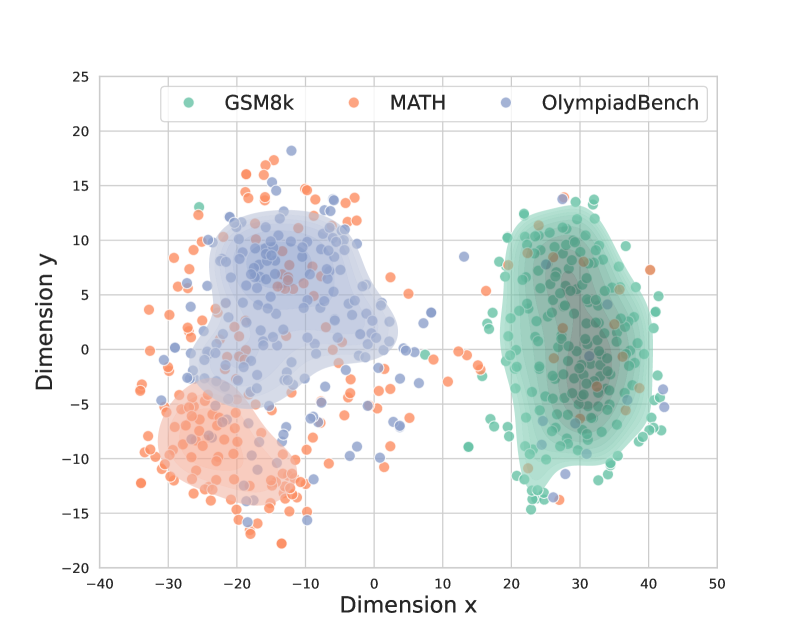
The image is a 2D scatter plot visualizing the distribution of data points from three distinct datasets: GSM8k, MATH, and OlympiadBench. The plot reveals clear clustering patterns, with each dataset occupying a distinct region in the 2D space defined by "Dimension x" and "Dimension y". The data points are semi-transparent, allowing density to be inferred from color saturation. Each dataset cluster is also overlaid with a shaded, semi-transparent polygon (a convex hull) that outlines the approximate boundary of its main data cloud.
### Components/Axes
* **Chart Type:** Scatter plot with cluster boundaries (convex hulls).
* **X-Axis:** Labeled "Dimension x". Scale ranges from -40 to 50, with major tick marks every 10 units.
* **Y-Axis:** Labeled "Dimension y". Scale ranges from -20 to 25, with major tick marks every 5 units.
* **Legend:** Positioned at the top center of the chart area. It contains three entries:
* A green circle labeled "GSM8k"
* An orange circle labeled "MATH"
* A blue circle labeled "OlympiadBench"
* **Data Series & Visual Encoding:**
* **GSM8k:** Represented by green dots. Its cluster is bounded by a light green shaded polygon.
* **MATH:** Represented by orange dots. Its cluster is bounded by a light orange shaded polygon.
* **OlympiadBench:** Represented by blue dots. Its cluster is bounded by a light blue shaded polygon.
### Detailed Analysis
**Spatial Distribution and Cluster Characteristics:**
1. **GSM8k (Green):**
* **Trend/Placement:** Forms a dense, vertically elongated cluster on the right side of the plot.
* **Approximate Center:** (x ≈ 30, y ≈ 0).
* **Range:** Primarily spans Dimension x from ~15 to ~40, and Dimension y from ~-15 to ~15.
* **Density:** High density in the core region (x=25-35, y=-5 to 5). Points become sparser towards the edges of its convex hull.
2. **MATH (Orange):**
* **Trend/Placement:** Forms a dense cluster in the bottom-left quadrant.
* **Approximate Center:** (x ≈ -20, y ≈ -8).
* **Range:** Primarily spans Dimension x from ~-35 to ~-5, and Dimension y from ~-18 to ~5.
* **Density:** Very high density in its core (x=-25 to -15, y=-12 to -4). It shows significant overlap with the lower portion of the OlympiadBench cluster.
3. **OlympiadBench (Blue):**
* **Trend/Placement:** Forms a dense cluster in the top-left quadrant.
* **Approximate Center:** (x ≈ -15, y ≈ 5).
* **Range:** Primarily spans Dimension x from ~-30 to ~5, and Dimension y from ~-5 to ~18.
* **Density:** High density in its core (x=-20 to -10, y=0 to 10). It overlaps substantially with the upper portion of the MATH cluster.
**Inter-Cluster Relationships:**
* There is a clear and wide separation along the x-axis between the **GSM8k** cluster (positive x) and the clusters for **MATH** and **OlympiadBench** (negative x).
* The **MATH** and **OlympiadBench** clusters are adjacent and overlap significantly in the region around (x ≈ -15, y ≈ -2). Their convex hulls merge in this area.
* A sparse scattering of outlier points from all three datasets exists in the central region of the plot (x ≈ -5 to 15, y ≈ -5 to 5), between the main clusters.
### Key Observations
1. **Distinct Separation of GSM8k:** The most prominent feature is the isolation of the GSM8k dataset along the positive x-axis, suggesting its data points have fundamentally different characteristics in this 2D projection compared to the other two datasets.
2. **Overlap of MATH and OlympiadBench:** These two datasets share a significant portion of the feature space, particularly in the negative x, mid-y region. This indicates potential similarity in the underlying properties being measured for a subset of their data.
3. **Cluster Shape:** The GSM8k cluster is vertically oriented, while the MATH and OlympiadBench clusters are more horizontally oriented and blob-like.
4. **Outliers:** All datasets have points that lie outside their main convex hull, scattered primarily in the central "gap" between the three primary clusters.
### Interpretation
This scatter plot likely visualizes the output of a dimensionality reduction technique (like t-SNE or PCA) applied to features from three mathematical reasoning benchmarks. The spatial arrangement suggests:
* **GSM8k (Grade School Math 8k)** problems form a distinct category in the feature space. Their separation implies the model's internal representations or the problem characteristics for grade-school level math are consistently different from more advanced math.
* **MATH** and **OlympiadBench** datasets, which both target more advanced mathematical problem-solving, are not fully distinct from each other. Their overlap indicates that a significant portion of problems from these benchmarks are processed similarly by the model or share underlying features. The OlympiadBench cluster extends slightly higher on the y-axis, which might hint at a subset of problems with even greater complexity or a different sub-type.
* The **central region of outliers** could represent ambiguous problems, problems that bridge the characteristics of the main clusters, or noise in the embedding process.
The visualization effectively demonstrates that while advanced math problems (MATH, OlympiadBench) share a common feature subspace, grade-school math (GSM8k) occupies a separate region, providing a clear visual distinction between problem difficulty levels in the analyzed embedding space.