## Scatter Plot: Dataset Distribution Analysis
### Overview
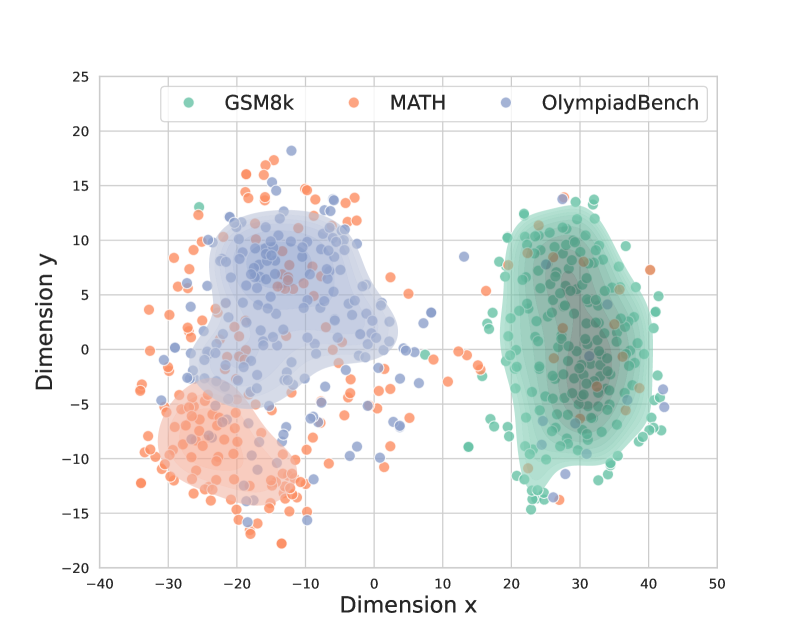
The image is a 2D scatter plot visualizing the distribution of three datasets (GSM8k, MATH, OlympiadBench) across two dimensions (x and y). Points are color-coded by dataset, with density shading indicating point concentration. The plot reveals distinct clustering patterns and spatial relationships between datasets.
### Components/Axes
- **Axes**:
- **X-axis**: "Dimension x" (range: -40 to 50)
- **Y-axis**: "Dimension y" (range: -20 to 25)
- **Legend**: Located in the top-right corner, associating:
- **Green**: GSM8k
- **Orange**: MATH
- **Blue**: OlympiadBench
- **Density Shading**: Semi-transparent gradients overlaying point clusters to highlight density.
### Detailed Analysis
1. **GSM8k (Green)**:
- **Positioning**: Dominates the right half of the plot (x: 20–40, y: 0–20).
- **Density**: Highest concentration near (x=30, y=10), with gradual tapering toward edges.
- **Outliers**: A few points extend leftward (x: 10–20, y: -5–5).
2. **MATH (Orange)**:
- **Positioning**: Concentrated in the lower-left quadrant (x: -30–0, y: -15–10).
- **Density**: Peaks near (x=-20, y=-5), with sparse points near the origin.
- **Overlap**: Minimal overlap with GSM8k; slight overlap with OlympiadBench near (x=0, y=0).
3. **OlympiadBench (Blue)**:
- **Positioning**: Broad distribution spanning x: -10–30 and y: -5–15.
- **Density**: Two main clusters:
- **Left Cluster**: x: -10–0, y: -5–5 (overlaps MATH).
- **Right Cluster**: x: 10–30, y: 5–15 (overlaps GSM8k).
- **Outliers**: Sparse points near (x=40, y=20) and (x=-20, y=-10).
### Key Observations
- **Clustering**: GSM8k and MATH form distinct clusters with minimal overlap, while OlympiadBench bridges the two.
- **Density Peaks**:
- GSM8k: (30, 10)
- MATH: (-20, -5)
- OlympiadBench: (-5, 0) and (25, 10)
- **Spatial Relationships**:
- OlympiadBench acts as a transitional dataset between GSM8k and MATH.
- No dataset dominates the entire plot; all occupy specific regions.
### Interpretation
The plot suggests that GSM8k and MATH represent distinct problem types or domains, as evidenced by their spatial separation. OlympiadBench, however, exhibits hybrid characteristics, potentially indicating a composite dataset or problems requiring skills from both GSM8k and MATH. The density shading confirms that GSM8k and MATH have more concentrated distributions, while OlympiadBench’s broader spread implies greater variability or interdisciplinary content. The overlap regions (e.g., near the origin) may highlight shared problem-solving strategies or ambiguous categorizations. This visualization could inform dataset curation, model training, or cross-domain analysis in computational problem-solving contexts.