## Bar Chart: Mean Success Rates: Real World vs World Model
### Overview
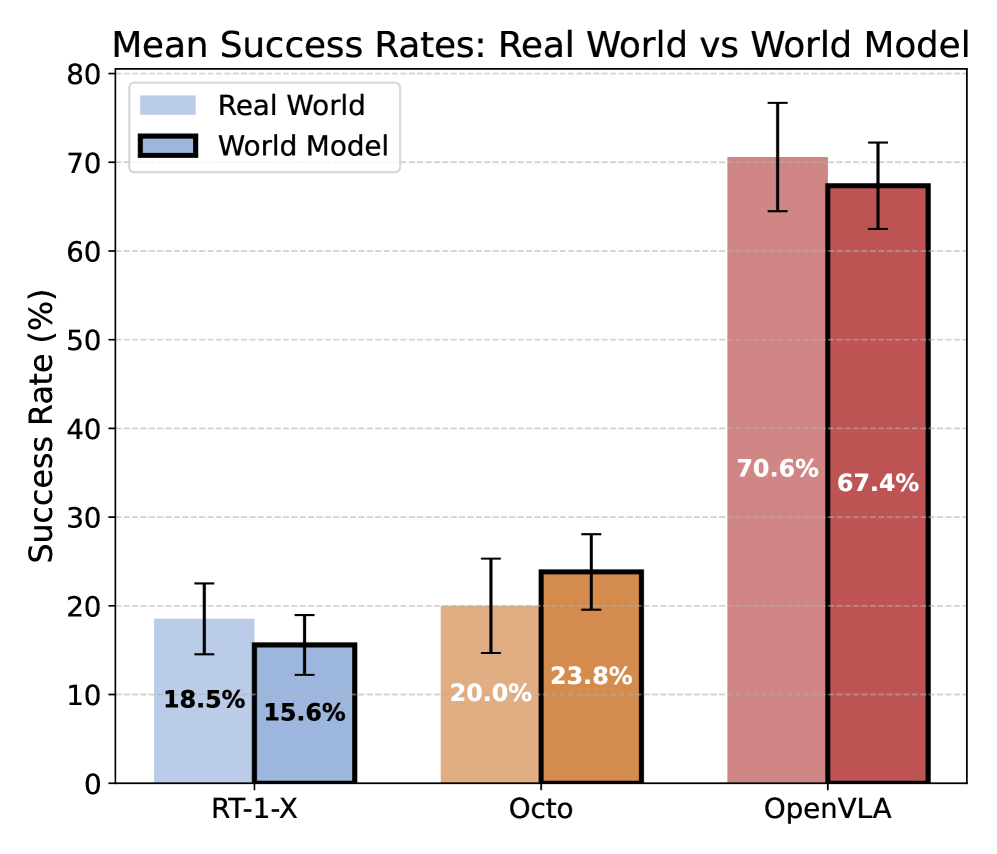
The image is a bar chart comparing the mean success rates of three different systems (RT-1-X, Octo, and OpenVLA) in two environments: "Real World" and "World Model". The chart displays the success rates as percentages, with error bars indicating variability.
### Components/Axes
* **Title:** Mean Success Rates: Real World vs World Model
* **X-axis:** Categorical axis representing the three systems: RT-1-1-X, Octo, and OpenVLA.
* **Y-axis:** Numerical axis labeled "Success Rate (%)", ranging from 0 to 80 in increments of 10. Horizontal gridlines are present at each increment.
* **Legend:** Located at the top-left of the chart.
* "Real World": Represented by light blue, light orange, and light red bars.
* "World Model": Represented by dark blue, dark orange, and dark red bars with black outlines.
### Detailed Analysis
The chart presents paired bars for each system, comparing the "Real World" and "World Model" success rates.
* **RT-1-X:**
* Real World: 18.5% (light blue bar)
* World Model: 15.6% (dark blue bar)
* **Octo:**
* Real World: 20.0% (light orange bar)
* World Model: 23.8% (dark orange bar)
* **OpenVLA:**
* Real World: 70.6% (light red bar)
* World Model: 67.4% (dark red bar)
Error bars are present on top of each bar, indicating the variability or standard deviation.
### Key Observations
* OpenVLA has significantly higher success rates compared to RT-1-X and Octo in both environments.
* RT-1-X has a slightly higher success rate in the Real World compared to the World Model.
* Octo has a slightly higher success rate in the World Model compared to the Real World.
* OpenVLA has a slightly higher success rate in the Real World compared to the World Model.
### Interpretation
The chart suggests that the OpenVLA system performs substantially better than RT-1-X and Octo in terms of success rate, regardless of whether it's operating in the real world or a simulated "world model". The differences between the real world and world model environments are relatively small for each system, but there are some differences. RT-1-X and OpenVLA perform slightly better in the real world, while Octo performs slightly better in the world model. The error bars indicate the variability in the success rates, which should be considered when interpreting the results. The error bars are not labeled with values, so the exact variability is unknown.