\n
## Bar Chart: Mean Success Rates: Real World vs World Model
### Overview
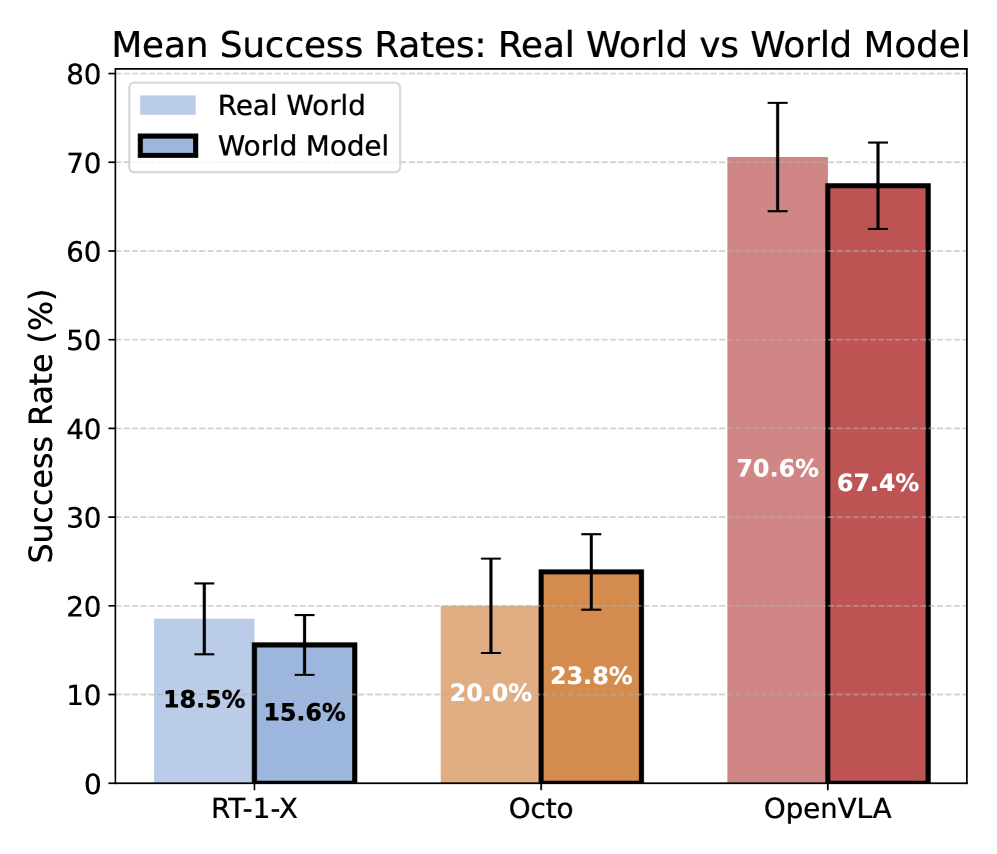
This is a grouped bar chart comparing the mean success rates (in percentage) of three different systems or models—RT-1-X, Octo, and OpenVLA—in two distinct environments: "Real World" and "World Model." The chart includes error bars for each data point.
### Components/Axes
* **Chart Title:** "Mean Success Rates: Real World vs World Model"
* **Y-Axis:**
* **Label:** "Success Rate (%)"
* **Scale:** Linear, ranging from 0 to 80, with major gridlines at intervals of 10 (0, 10, 20, 30, 40, 50, 60, 70, 80).
* **X-Axis:**
* **Categories (from left to right):** "RT-1-X", "Octo", "OpenVLA".
* **Legend:**
* **Position:** Top-left corner of the plot area.
* **Series 1:** "Real World" - Represented by light blue bars.
* **Series 2:** "World Model" - Represented by dark blue bars with a thick black outline.
* **Data Labels:** The exact percentage value is printed in white text inside each bar.
* **Error Bars:** Each bar has a black, vertical error bar extending above and below the top of the bar, indicating variability or confidence intervals.
### Detailed Analysis
The chart presents the following data points for each system:
**1. RT-1-X (Leftmost Group)**
* **Real World (Light Blue Bar):** Success Rate = **18.5%**. The error bar extends approximately from 15% to 22%.
* **World Model (Dark Blue Bar):** Success Rate = **15.6%**. The error bar extends approximately from 12% to 19%.
* **Trend:** The Real World performance is slightly higher than the World Model performance for this system.
**2. Octo (Middle Group)**
* **Real World (Light Blue Bar):** Success Rate = **20.0%**. The error bar extends approximately from 15% to 25%.
* **World Model (Dark Blue Bar):** Success Rate = **23.8%**. The error bar extends approximately from 20% to 28%.
* **Trend:** The World Model performance is slightly higher than the Real World performance for this system.
**3. OpenVLA (Rightmost Group)**
* **Real World (Light Blue Bar):** Success Rate = **70.6%**. The error bar extends approximately from 65% to 76%.
* **World Model (Dark Blue Bar):** Success Rate = **67.4%**. The error bar extends approximately from 62% to 72%.
* **Trend:** The Real World performance is slightly higher than the World Model performance for this system.
### Key Observations
1. **Dominant Performance:** The OpenVLA system demonstrates a dramatically higher success rate (around 70%) in both environments compared to RT-1-X and Octo (both around 20% or lower).
2. **Model-Real World Correlation:** For each system, the success rates in the "Real World" and "World Model" are relatively close, suggesting the world models are reasonably predictive of real-world performance, though not perfectly aligned.
3. **Performance Gap Direction:** The direction of the gap between Real World and World Model performance is not consistent. RT-1-X and OpenVLA perform better in the Real World, while Octo performs better in its World Model.
4. **Variability:** The error bars for OpenVLA are larger in absolute terms (spanning ~10-11 percentage points) compared to RT-1-X and Octo (spanning ~4-7 percentage points), though this is proportional to the higher mean values.
### Interpretation
The data strongly suggests that the **OpenVLA system is significantly more capable** than the RT-1-X and Octo systems for the tasks measured, achieving success rates over three times higher. The close correspondence between "Real World" and "World Model" results for each system indicates that the simulated environments (world models) used for evaluation are **valid proxies** for real-world performance, capturing the relative ranking and approximate magnitude of success. However, the consistent small discrepancies (2-3 percentage points) and the reversal of the gap direction for Octo highlight that these simulations are **not perfect replicas**; unmodeled factors in the real world or simplifications in the simulation can slightly alter outcomes. The larger error bars for OpenVLA may indicate greater sensitivity to initial conditions or task variations when operating at a higher performance level.