## Violin Plots: Causal Effect Analysis by Dataset Size and Condition
### Overview
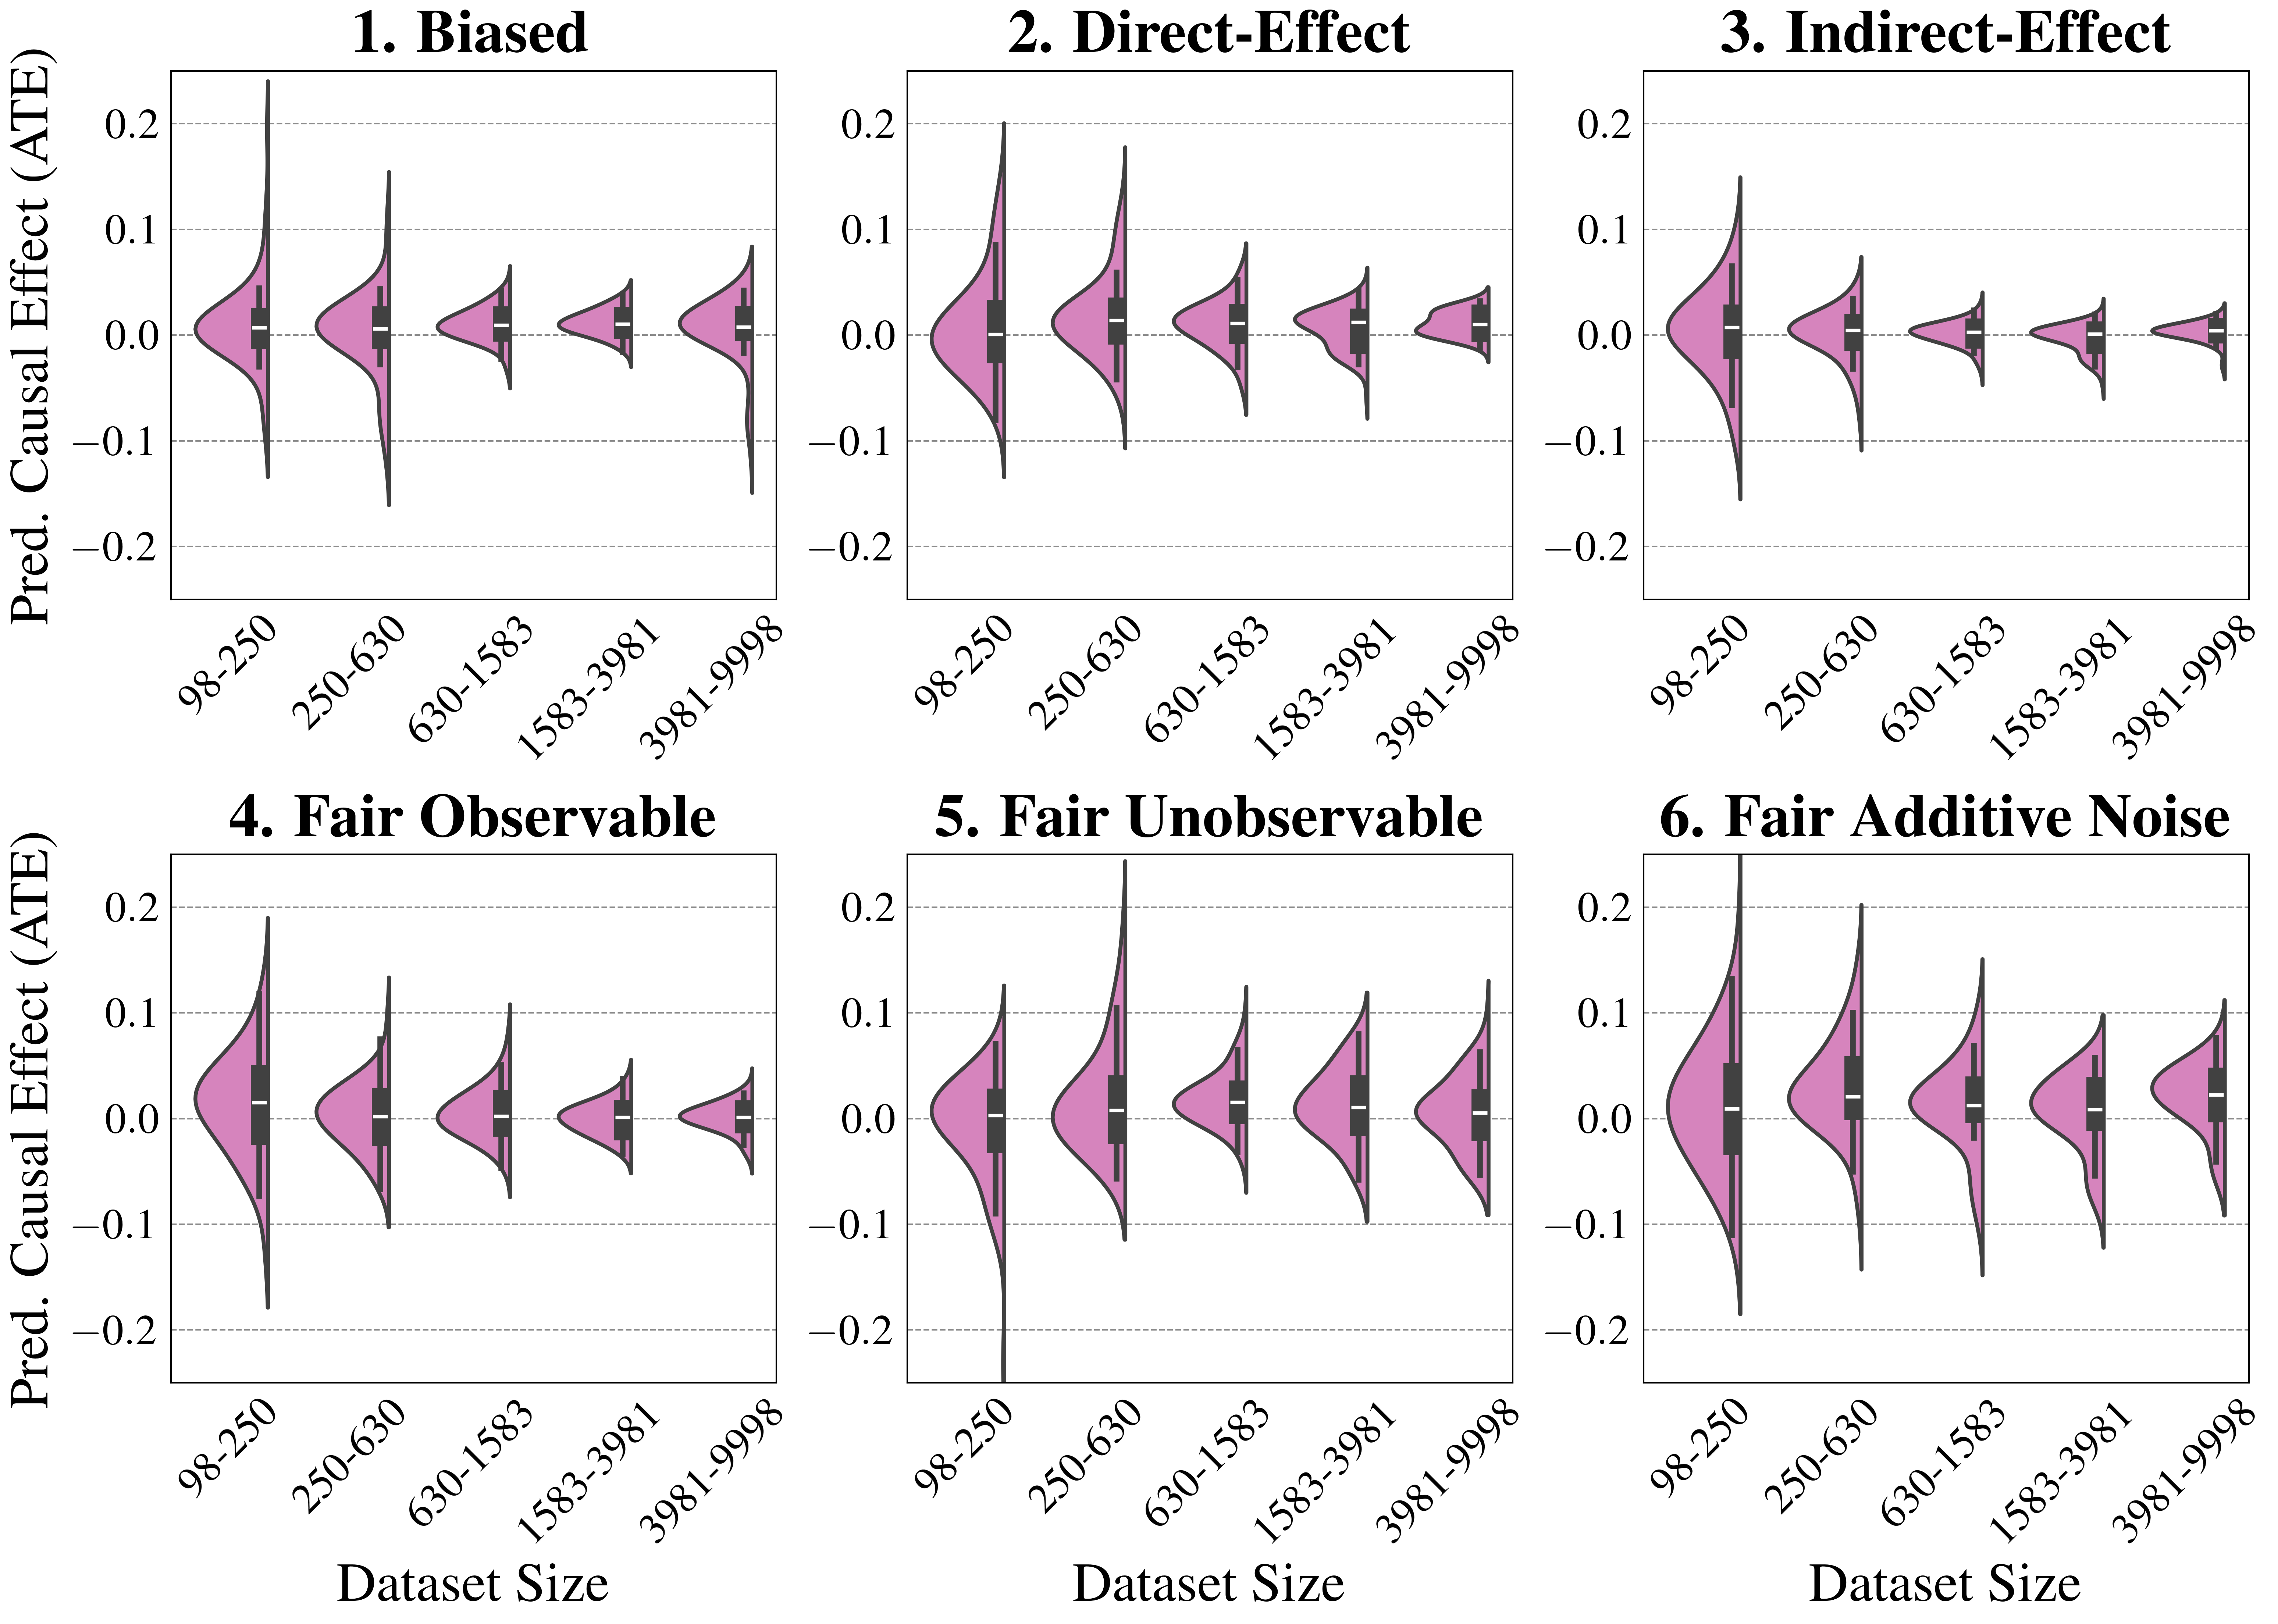
The image presents six violin plots arranged in two rows and three columns, comparing predicted causal effects (ATE) across different dataset sizes and experimental conditions. Each plot visualizes the distribution of causal effect estimates, with black box plots indicating median, quartiles, and outliers. The x-axis represents dataset size ranges (98-250, 250-630, 630-1583, 1583-3981, 3981-9998), while the y-axis shows causal effect values from -0.2 to 0.2.
### Components/Axes
- **X-axis (Dataset Size)**: Categorical ranges (98-250, 250-630, 630-1583, 1583-3981, 3981-9998)
- **Y-axis (Pred. Causal Effect (ATE))**: Continuous scale from -0.2 to 0.2
- **Violin Plots**: Purple distributions with black box plots (median, quartiles, outliers)
- **Titles**: Six conditions labeled 1-6 (Biased, Direct-Effect, Indirect-Effect, Fair Observable, Fair Unobservable, Fair Additive Noise)
### Detailed Analysis
1. **Biased (1)**:
- Distributions centered near 0 with moderate spread.
- Median values stable across dataset sizes (~-0.02 to 0.02).
- Outliers present in smaller datasets (98-250).
2. **Direct-Effect (2)**:
- Slight positive trend as dataset size increases.
- Median shifts from ~0.01 (98-250) to ~0.05 (3981-9998).
- Spread narrows with larger datasets.
3. **Indirect-Effect (3)**:
- Slight negative trend with increasing dataset size.
- Median decreases from ~0.03 (98-250) to ~-0.02 (3981-9998).
- Distributions become tighter in larger datasets.
4. **Fair Observable (4)**:
- Similar to Biased but with reduced spread.
- Median values stable (~-0.01 to 0.01).
- Fewer outliers across all dataset sizes.
5. **Fair Unobservable (5)**:
- Increased variability in larger datasets.
- Median values stable (~-0.01 to 0.01).
- Wider distributions in 1583-3981 and 3981-9998 ranges.
6. **Fair Additive Noise (6)**:
- Distributions widen significantly with dataset size.
- Median values stable (~-0.01 to 0.01).
- Outliers increase in frequency for 250-630 and larger datasets.
### Key Observations
- **Trend Divergence**: Direct-Effect (positive trend) and Indirect-Effect (negative trend) show opposing directional biases.
- **Noise Impact**: Fair Additive Noise (6) exhibits the largest spread, suggesting noise amplifies uncertainty.
- **Dataset Size Effects**: Larger datasets (3981-9998) generally show tighter distributions except in Fair Unobservable and Fair Additive Noise.
- **Condition-Specific Variability**: Fair Unobservable (5) and Fair Additive Noise (6) demonstrate higher sensitivity to dataset size changes.
### Interpretation
The plots reveal how experimental conditions influence causal effect estimation:
1. **Biased vs. Fair Conditions**: Fair conditions (4-6) show reduced spread compared to Biased (1), indicating better estimation stability.
2. **Direct vs. Indirect Effects**: Direct-Effect (2) demonstrates a consistent positive bias, while Indirect-Effect (3) shows a negative bias, suggesting methodological differences in effect measurement.
3. **Noise Sensitivity**: Fair Additive Noise (6) highlights how noise introduces uncertainty, particularly in larger datasets where spread increases despite more data.
4. **Unobservable Factors**: Fair Unobservable (5) shows dataset size has diminishing returns for reducing variability, implying unobservable confounders persist even with more data.
These patterns suggest that experimental design (e.g., noise control, observability) critically impacts causal inference reliability, with larger datasets offering limited benefits in certain conditions.