# Technical Data Extraction: Performance Analysis of LLMs under Induced Error
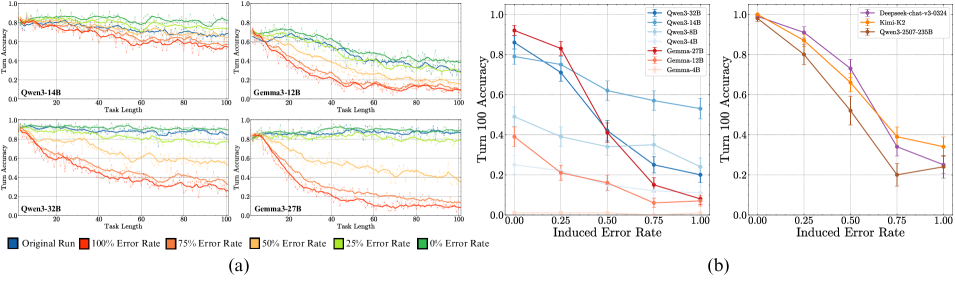
This document provides a comprehensive extraction of data from a technical figure containing multiple line charts. The figure is divided into two primary sections: **(a)**, which shows accuracy over task length for specific models, and **(b)**, which shows accuracy at a specific turn (Turn 100) relative to induced error rates.
---
## Section (a): Turn Accuracy vs. Task Length
This section consists of four sub-plots, each representing a different Large Language Model (LLM).
### Common Axis and Legend Information
* **Y-Axis:** "Turn Accuracy" (Scale: 0.0 to 1.0).
* **X-Axis:** "Task Length" (Scale: 0 to 100).
* **Legend (Bottom Left):**
* **Dark Blue Square:** Original Run
* **Red Square:** 100% Error Rate
* **Orange Square:** 75% Error Rate
* **Yellow Square:** 50% Error Rate
* **Light Green Square:** 25% Error Rate
* **Dark Green Square:** 0% Error Rate
### Sub-plot 1: Qwen3-14B
* **Trend:** Performance is relatively stable for low error rates (0%, 25%, Original). As the error rate increases (50% to 100%), accuracy degrades significantly as task length increases.
* **Data Points (Approximate at Task Length 100):**
* 0% Error Rate (Dark Green): ~0.8
* 25% Error Rate (Light Green): ~0.75
* Original Run (Dark Blue): ~0.7
* 50% Error Rate (Yellow): ~0.65
* 75% Error Rate (Orange): ~0.55
* 100% Error Rate (Red): ~0.5
### Sub-plot 2: Gemma3-12B
* **Trend:** Shows a much steeper decline in accuracy compared to Qwen3-14B. Even at low error rates, accuracy drops below 0.4 by task length 100.
* **Data Points (Approximate at Task Length 100):**
* 0% Error Rate (Dark Green): ~0.4
* 25% Error Rate (Light Green): ~0.3
* Original Run (Dark Blue): ~0.3
* 50% Error Rate (Yellow): ~0.2
* 75% Error Rate (Orange): ~0.15
* 100% Error Rate (Red): ~0.1
### Sub-plot 3: Qwen3-32B
* **Trend:** High resilience. The 0%, 25%, and Original runs maintain accuracy above 0.8 throughout the task. Higher error rates (75%, 100%) show a steady decline but remain higher than the Gemma models.
* **Data Points (Approximate at Task Length 100):**
* 0%/25%/Original: ~0.85 - 0.9
* 50% Error Rate (Yellow): ~0.6
* 75% Error Rate (Orange): ~0.35
* 100% Error Rate (Red): ~0.3
### Sub-plot 4: Gemma3-27B
* **Trend:** Similar to the 12B version, it shows a rapid collapse in accuracy for high error rates, though the 0% and 25% rates stay higher (~0.8) than the 12B model.
* **Data Points (Approximate at Task Length 100):**
* 0%/25% Error Rate: ~0.8 - 0.85
* 50% Error Rate (Yellow): ~0.4
* 75% Error Rate (Orange): ~0.15
* 100% Error Rate (Red): ~0.1
---
## Section (b): Turn 100 Accuracy vs. Induced Error Rate
This section contains two charts comparing different model families.
### Common Axis Information
* **Y-Axis:** "Turn 100 Accuracy" (Scale: 0.0 to 1.0).
* **X-Axis:** "Induced Error Rate" (Markers: 0.00, 0.25, 0.50, 0.75, 1.00).
### Left Chart (Qwen vs. Gemma)
**Legend (Top Right):**
* **Blue Tones (Qwen):** Qwen3-32B (Darkest), Qwen3-14B, Qwen3-8B, Qwen3-4B (Lightest).
* **Red/Orange Tones (Gemma):** Gemma-27B (Darkest), Gemma-12B, Gemma-4B (Lightest).
**Key Trends:**
* **Qwen Series:** Generally more robust. Qwen3-32B starts at ~0.85 and ends at ~0.55.
* **Gemma Series:** Starts higher (Gemma-27B at ~0.92) but drops precipitously to near 0.1 accuracy as error rate reaches 1.00.
### Right Chart (Competitive Models)
**Legend (Top Right):**
* **Purple Line:** Deepseek-chat-v3-0324
* **Yellow Line:** Kimi-k2
* **Brown Line:** Qwen3-2507-235B
**Data Extraction (Approximate Values):**
| Induced Error Rate | Deepseek-chat-v3 | Kimi-k2 | Qwen3-2507-235B |
| :--- | :--- | :--- | :--- |
| **0.00** | 1.0 | 1.0 | 0.98 |
| **0.25** | 0.91 | 0.87 | 0.80 |
| **0.50** | 0.73 | 0.66 | 0.52 |
| **0.75** | 0.34 | 0.39 | 0.20 |
| **1.00** | 0.25 | 0.34 | 0.24 |
**Trend Observation:** All three high-parameter models show a sharp, non-linear decline in accuracy as the induced error rate increases. Deepseek maintains the highest accuracy until the 0.75 mark, where Kimi-k2 becomes slightly more resilient.