## Diagram: Grid Pathfinding Visualization
### Overview
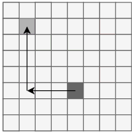
The image displays a 7x7 square grid containing two shaded cells and a directional path indicated by two arrows. The diagram illustrates a movement or relationship between two distinct points on a coordinate plane. There are no text labels, numbers, or legends present in the image.
### Components/Axes
* **Grid Structure:** A 7x7 matrix composed of 49 equal-sized square cells.
* **Shaded Cells:**
* **Light Gray Square:** Located in the top-left quadrant of the grid.
* **Dark Gray Square:** Located in the bottom-right quadrant of the grid.
* **Arrows:**
* **Horizontal Arrow:** A line segment with an arrowhead pointing left.
* **Vertical Arrow:** A line segment with an arrowhead pointing up.
### Detailed Analysis
To facilitate precise description, the grid is indexed using a 1-based coordinate system (Row, Column), where (1,1) is the top-left cell and (7,7) is the bottom-right cell.
* **Grid Layout:** The grid consists of 7 rows and 7 columns.
* **Positioning of Elements:**
* **Light Gray Square:** Positioned at Row 2, Column 2.
* **Dark Gray Square:** Positioned at Row 5, Column 5.
* **Path Analysis:**
* **Horizontal Segment:** The arrow originates at the center of the Dark Gray Square (5,5) and points left, terminating at the intersection of Row 5 and Column 3.
* **Vertical Segment:** The arrow originates at the intersection of Row 5 and Column 3 (the "elbow" of the path) and points upward, terminating at the center of the Light Gray Square (2,2).
* **Visual Trend:** The path describes a non-diagonal, rectilinear movement from the bottom-right shaded cell to the top-left shaded cell, moving first horizontally (left) and then vertically (up).
### Key Observations
* **Rectilinear Movement:** The path strictly follows the grid lines, suggesting a constraint to orthogonal movement (up, down, left, right).
* **Path Efficiency:** The path represents a "Manhattan distance" calculation, where the total distance is the sum of the absolute differences of the coordinates: |5-2| + |5-2| = 3 + 3 = 6 units of movement.
* **Asymmetry:** The two shaded squares have different grayscale values, potentially indicating a hierarchy (e.g., Start vs. End, or Source vs. Destination). The darker square (5,5) acts as the source, and the lighter square (2,2) acts as the destination.
### Interpretation
This diagram is a classic representation of **Manhattan Distance** (also known as Taxicab geometry) or a pathfinding algorithm visualization (such as A* or Dijkstra's algorithm) on a grid.
* **What the data demonstrates:** It visualizes the concept that in a grid-based environment, the shortest path between two points is not a straight diagonal line, but a combination of horizontal and vertical steps.
* **Peircean Investigative:** The use of arrows implies a temporal or causal sequence—a "flow" from the dark square to the light square. The "elbow" at (5,3) is a critical node, representing the point of decision where the path changes direction.
* **Reading between the lines:** This image is likely a simplified model used in computer science or logistics to explain how agents (like robots or delivery vehicles) navigate a city grid or a digital matrix where diagonal movement is prohibited or impossible. The distinct shading suggests a clear distinction between the origin (darker) and the target (lighter).