## Chart: Betweenness Centrality Over Time and Per Iteration
### Overview
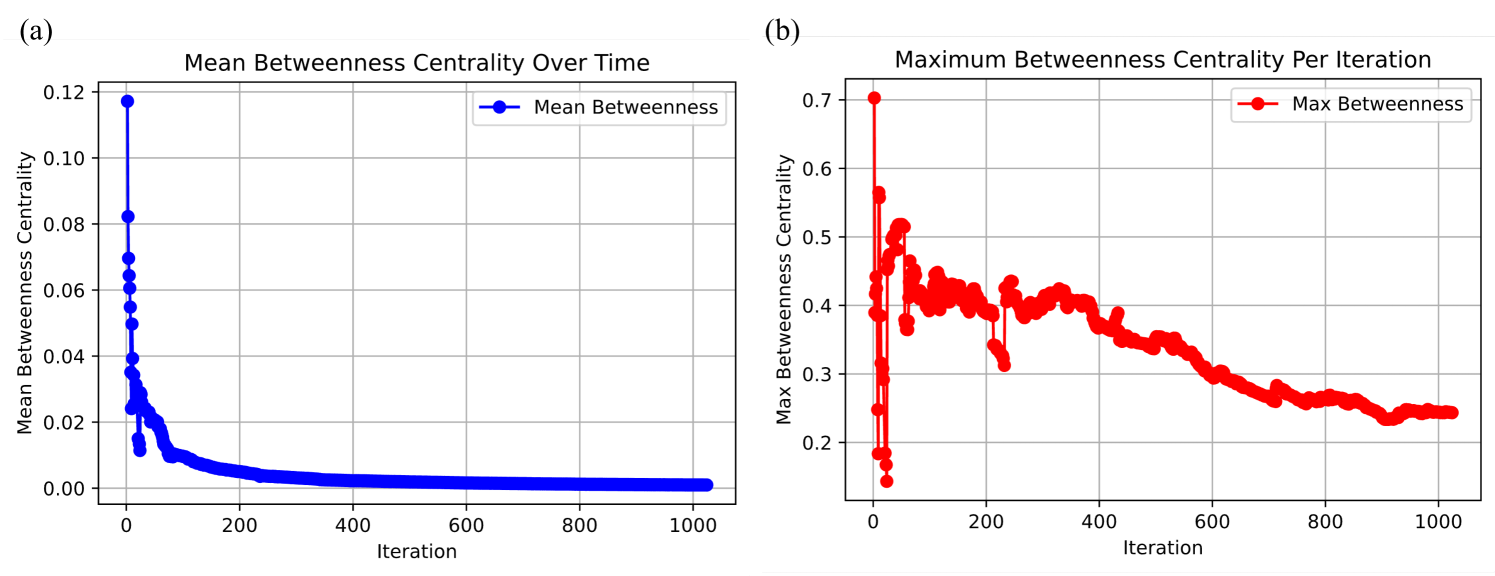
The image presents two line charts side-by-side, comparing the mean and maximum betweenness centrality over 1000 iterations. The left chart (a) displays the mean betweenness centrality, which rapidly decreases and stabilizes near zero. The right chart (b) shows the maximum betweenness centrality per iteration, exhibiting an initial spike followed by a fluctuating decrease and eventual stabilization.
### Components/Axes
**Chart (a): Mean Betweenness Centrality Over Time**
* **Title:** Mean Betweenness Centrality Over Time
* **X-axis:** Iteration, with markers at 0, 200, 400, 600, 800, and 1000.
* **Y-axis:** Mean Betweenness Centrality, with markers at 0.00, 0.02, 0.04, 0.06, 0.08, 0.10, and 0.12.
* **Legend:** Located in the top-right corner, indicating that the blue line represents "Mean Betweenness".
**Chart (b): Maximum Betweenness Centrality Per Iteration**
* **Title:** Maximum Betweenness Centrality Per Iteration
* **X-axis:** Iteration, with markers at 0, 200, 400, 600, 800, and 1000.
* **Y-axis:** Max Betweenness Centrality, with markers at 0.2, 0.3, 0.4, 0.5, 0.6, and 0.7.
* **Legend:** Located in the top-right corner, indicating that the red line represents "Max Betweenness".
### Detailed Analysis
**Chart (a): Mean Betweenness Centrality Over Time**
* **Trend:** The blue line, representing the mean betweenness, exhibits a steep downward slope from iteration 0 to approximately 200. After iteration 200, the line flattens out, indicating a stabilization of the mean betweenness centrality near zero.
* **Data Points:**
* At iteration 0, the mean betweenness centrality is approximately 0.12.
* At iteration 20, the mean betweenness centrality is approximately 0.04.
* At iteration 100, the mean betweenness centrality is approximately 0.01.
* From iteration 200 onwards, the mean betweenness centrality remains close to 0.01 or less.
**Chart (b): Maximum Betweenness Centrality Per Iteration**
* **Trend:** The red line, representing the maximum betweenness, starts with a high value at iteration 0, then fluctuates significantly between iterations 0 and 400. From iteration 400 onwards, the line gradually decreases and stabilizes.
* **Data Points:**
* At iteration 0, the max betweenness centrality is approximately 0.7.
* At iteration 50, the max betweenness centrality is approximately 0.52.
* At iteration 200, the max betweenness centrality is approximately 0.45.
* At iteration 400, the max betweenness centrality is approximately 0.4.
* At iteration 800, the max betweenness centrality is approximately 0.27.
* From iteration 900 onwards, the max betweenness centrality remains close to 0.24.
### Key Observations
* The mean betweenness centrality decreases rapidly and stabilizes near zero, suggesting that the average influence of nodes in the network diminishes quickly over iterations.
* The maximum betweenness centrality exhibits more variability, indicating that while the average influence decreases, some nodes continue to have a significant influence on the network.
* Both charts show a stabilization of betweenness centrality after a certain number of iterations, suggesting a convergence of the network's structure or dynamics.
### Interpretation
The data suggests that the network undergoes a process where the average influence of nodes decreases significantly over time, while the influence of the most central nodes fluctuates before eventually stabilizing. This could be indicative of a network where initial high-influence nodes become less critical as the network evolves, and the overall structure becomes more distributed. The initial spike in maximum betweenness centrality followed by a decrease suggests that the network initially relies on a few highly central nodes, but over time, the influence becomes more evenly distributed, leading to a lower maximum betweenness centrality. The stabilization of both mean and maximum betweenness centrality indicates that the network reaches a relatively stable state after a certain number of iterations.