\n
## Charts: Betweenness Centrality Over Time
### Overview
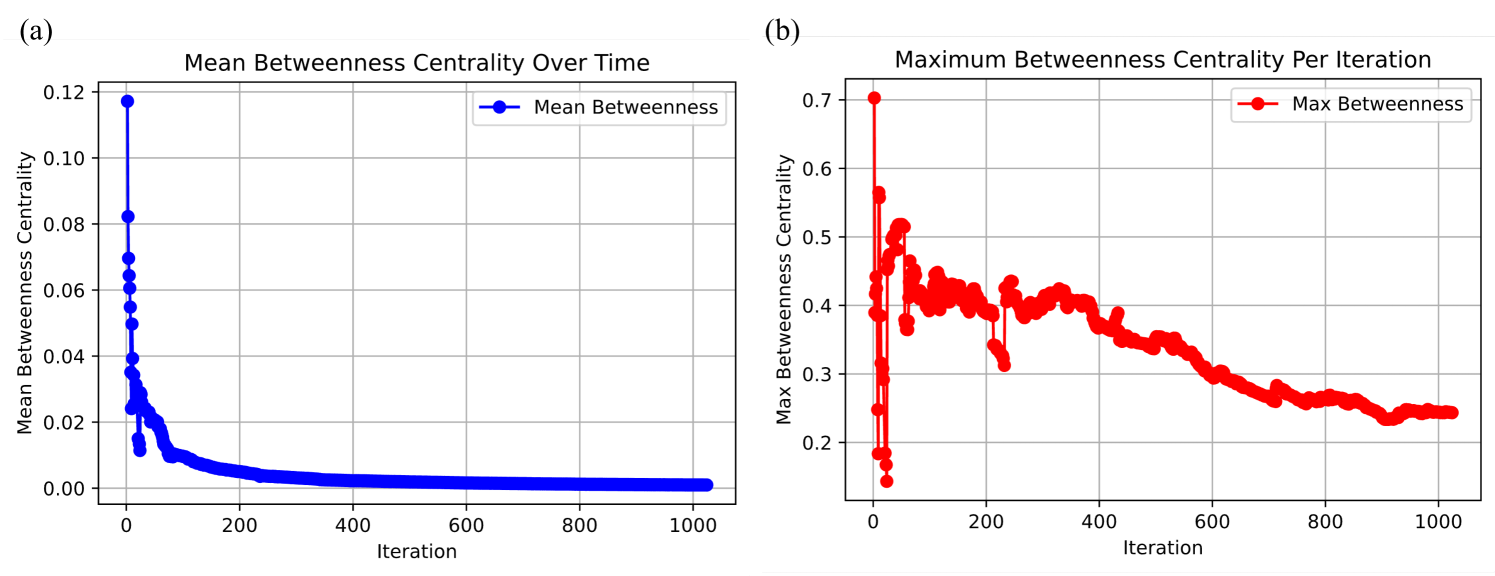
The image presents two line charts, labeled (a) and (b), both depicting the evolution of betweenness centrality metrics over 1000 iterations. Chart (a) shows the mean betweenness centrality, while chart (b) displays the maximum betweenness centrality. Both charts share a common x-axis representing "Iteration" from 0 to 1000.
### Components/Axes
**Chart (a): Mean Betweenness Centrality Over Time**
* **Title:** Mean Betweenness Centrality Over Time
* **X-axis:** Iteration (0 to 1000)
* **Y-axis:** Mean Betweenness Centrality (0 to 0.12)
* **Data Series:** "Mean Betweenness" (represented by a blue line with circular markers)
**Chart (b): Maximum Betweenness Centrality Per Iteration**
* **Title:** Maximum Betweenness Centrality Per Iteration
* **X-axis:** Iteration (0 to 1000)
* **Y-axis:** Max Betweenness Centrality (0 to 0.7)
* **Data Series:** "Max Betweenness" (represented by a red line with circular markers)
### Detailed Analysis
**Chart (a): Mean Betweenness Centrality Over Time**
The blue line representing "Mean Betweenness" starts at approximately 0.11 at Iteration 0, rapidly decreases to around 0.01 by Iteration 50, and then continues to decline, approaching 0 by Iteration 1000. The decline is steepest in the first 50 iterations, becoming more gradual afterward.
* Iteration 0: Mean Betweenness ≈ 0.11
* Iteration 50: Mean Betweenness ≈ 0.01
* Iteration 100: Mean Betweenness ≈ 0.005
* Iteration 200: Mean Betweenness ≈ 0.002
* Iteration 400: Mean Betweenness ≈ 0.001
* Iteration 600: Mean Betweenness ≈ 0.0005
* Iteration 800: Mean Betweenness ≈ 0.0002
* Iteration 1000: Mean Betweenness ≈ 0.0001
**Chart (b): Maximum Betweenness Centrality Per Iteration**
The red line representing "Max Betweenness" begins at approximately 0.65 at Iteration 0, initially increases to a peak of around 0.7 at Iteration 20, then decreases with fluctuations, settling around 0.4 by Iteration 200. From Iteration 200 to 800, the line exhibits oscillations around 0.4, and then declines to approximately 0.25 by Iteration 1000.
* Iteration 0: Max Betweenness ≈ 0.65
* Iteration 20: Max Betweenness ≈ 0.7
* Iteration 50: Max Betweenness ≈ 0.6
* Iteration 100: Max Betweenness ≈ 0.55
* Iteration 200: Max Betweenness ≈ 0.4
* Iteration 400: Max Betweenness ≈ 0.42
* Iteration 600: Max Betweenness ≈ 0.38
* Iteration 800: Max Betweenness ≈ 0.35
* Iteration 1000: Max Betweenness ≈ 0.25
### Key Observations
* Both charts demonstrate a decreasing trend in betweenness centrality over time.
* The mean betweenness centrality (Chart a) decreases more consistently and rapidly than the maximum betweenness centrality (Chart b).
* The maximum betweenness centrality (Chart b) exhibits significant fluctuations throughout the iterations, suggesting dynamic changes in the network's structure.
* The initial peak in maximum betweenness centrality (Chart b) could indicate an initial period of high connectivity or influence.
### Interpretation
These charts likely represent the evolution of a network's structure over time, as measured by betweenness centrality. Betweenness centrality quantifies the number of shortest paths between other nodes that pass through a given node. A decreasing mean betweenness centrality suggests that, on average, nodes are becoming less important in connecting other parts of the network. The decreasing maximum betweenness centrality indicates that the most influential nodes are losing their centrality over time.
The initial peak in maximum betweenness centrality could represent a period of network formation or initial high connectivity. The subsequent decline and fluctuations suggest that the network is evolving, with connections being rewired and influence shifting among nodes. The consistent decline in mean betweenness suggests a general trend towards a more decentralized or less interconnected network structure.
The difference between the two curves suggests that while the overall centrality of the network is decreasing, there are still individual nodes that maintain relatively high centrality, albeit with fluctuations. This could indicate the presence of key nodes that continue to play a role in the network's structure, even as the network evolves.