## Line Charts: Betweenness Centrality Metrics Over Iterations
### Overview
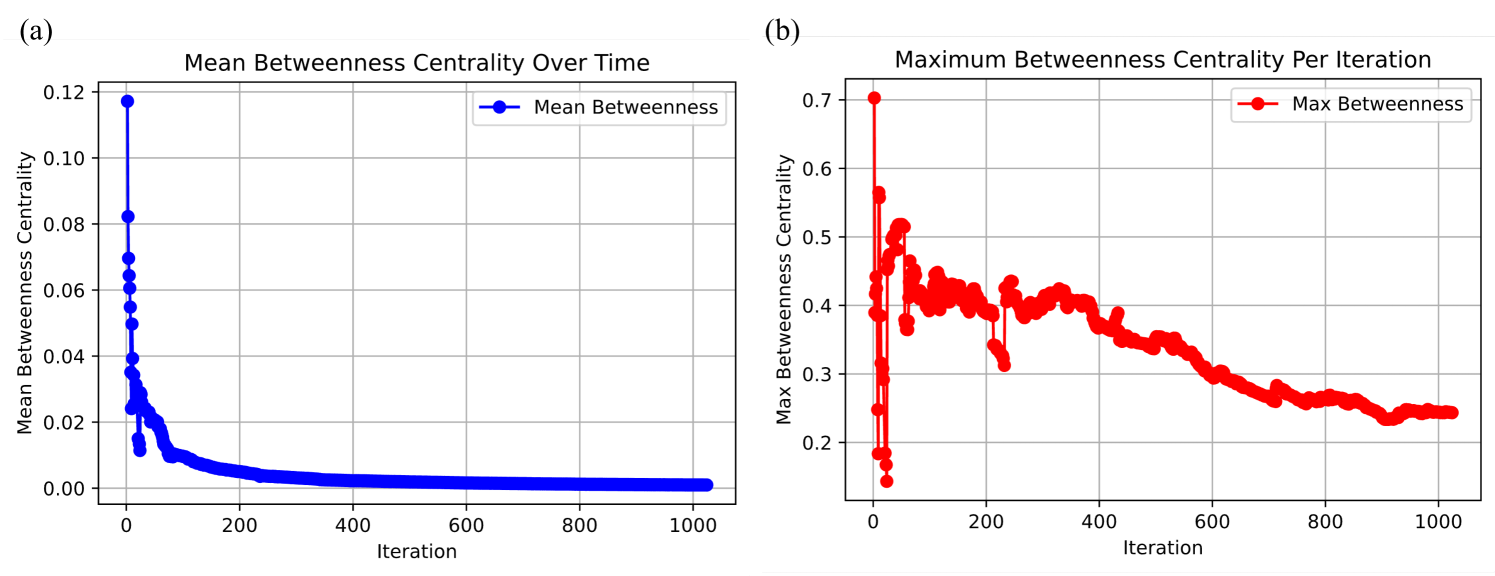
The image displays two side-by-side line charts, labeled (a) and (b), which plot network centrality metrics against the number of iterations of an unspecified process. Both charts share the same x-axis ("Iteration") but measure different aspects of betweenness centrality on their respective y-axes. The charts use distinct colors (blue and red) and markers to differentiate the data series.
### Components/Axes
**Chart (a) - Left Panel:**
* **Title:** "Mean Betweenness Centrality Over Time"
* **X-axis:** Label: "Iteration". Scale: Linear, from 0 to 1000, with major ticks at 0, 200, 400, 600, 800, 1000.
* **Y-axis:** Label: "Mean Betweenness Centrality". Scale: Linear, from 0.00 to 0.12, with major ticks at 0.00, 0.02, 0.04, 0.06, 0.08, 0.10, 0.12.
* **Legend:** Positioned in the top-right corner. Contains a blue line with a circular marker labeled "Mean Betweenness".
* **Data Series:** A single blue line with circular markers.
**Chart (b) - Right Panel:**
* **Title:** "Maximum Betweenness Centrality Per Iteration"
* **X-axis:** Label: "Iteration". Scale: Linear, from 0 to 1000, with major ticks at 0, 200, 400, 600, 800, 1000.
* **Y-axis:** Label: "Max Betweenness Centrality". Scale: Linear, from 0.2 to 0.7, with major ticks at 0.2, 0.3, 0.4, 0.5, 0.6, 0.7.
* **Legend:** Positioned in the top-right corner. Contains a red line with a circular marker labeled "Max Betweenness".
* **Data Series:** A single red line with circular markers.
### Detailed Analysis
**Chart (a) - Mean Betweenness Centrality:**
* **Trend Verification:** The blue line exhibits a very sharp, near-vertical decline at the beginning, followed by a rapid deceleration in the rate of decrease, eventually approaching and stabilizing near zero.
* **Data Points (Approximate):**
* Iteration 0: ~0.118 (highest point).
* Iteration ~10: ~0.082.
* Iteration ~20: ~0.070.
* Iteration ~50: ~0.035.
* Iteration ~100: ~0.015.
* Iteration ~200: ~0.008.
* Iteration ~400: ~0.003.
* Iteration ~600 to 1000: The value asymptotically approaches 0.000, appearing to be below 0.001 by iteration 1000.
**Chart (b) - Maximum Betweenness Centrality:**
* **Trend Verification:** The red line shows high initial volatility with a sharp spike, followed by a period of significant fluctuation, and then a more gradual, noisy decline over the remaining iterations.
* **Data Points (Approximate):**
* Iteration 0: ~0.70 (highest point, sharp spike).
* Iteration ~5: ~0.15 (sharp drop to a local minimum).
* Iteration ~10: ~0.56 (rebound).
* Iteration ~50: ~0.52.
* Iteration ~100: ~0.42.
* Iteration ~200: ~0.40.
* Iteration ~300: ~0.41.
* Iteration ~400: ~0.38.
* Iteration ~600: ~0.30.
* Iteration ~800: ~0.26.
* Iteration ~1000: ~0.24.
### Key Observations
1. **Contrasting Scales:** The mean centrality (chart a) operates on a much smaller scale (0.00-0.12) compared to the maximum centrality (chart b, 0.2-0.7), indicating that the average node's importance is low, but the most important node is significantly more central.
2. **Initial Transient Phase:** Both metrics show dramatic changes in the first ~50-100 iterations, suggesting a rapid reorganization of the network's structure early in the process.
3. **Convergence vs. Persistence:** The mean betweenness converges smoothly and quickly to near-zero. In contrast, the maximum betweenness, while trending downward, remains substantially above zero and exhibits persistent fluctuations, indicating that a few key nodes retain relatively high centrality throughout.
4. **Volatility:** Chart (b) is far more volatile than chart (a). The maximum centrality can change dramatically between consecutive iterations (e.g., the drop from ~0.70 to ~0.15), while the mean changes smoothly.
### Interpretation
The data suggests a dynamic network process where the overall structure becomes increasingly decentralized over time. The rapid drop in **mean betweenness centrality** indicates that, on average, nodes become less critical for connecting other nodes in the network; shortest paths are likely being distributed more evenly or the network is fragmenting.
However, the **maximum betweenness centrality** tells a more nuanced story. Its initial spike and subsequent high values imply that at least one node (or a small set of nodes) acts as a major hub or bridge early on. The gradual decline of this maximum value suggests these hubs slowly lose their dominant position, but the persistent fluctuations indicate the network's "backbone" or most critical pathways are unstable and shift between different nodes as the iterations progress. The process appears to move from a centralized, hub-dominated structure toward a more distributed one, but the presence of a persistently high maximum centrality shows the transition is incomplete, and key structural nodes remain important. This pattern is common in network optimization, resilience testing, or adaptive network models where connections are rewired or weighted over time.