## Line Graphs: Mean and Maximum Betweenness Centrality Over Iterations
### Overview
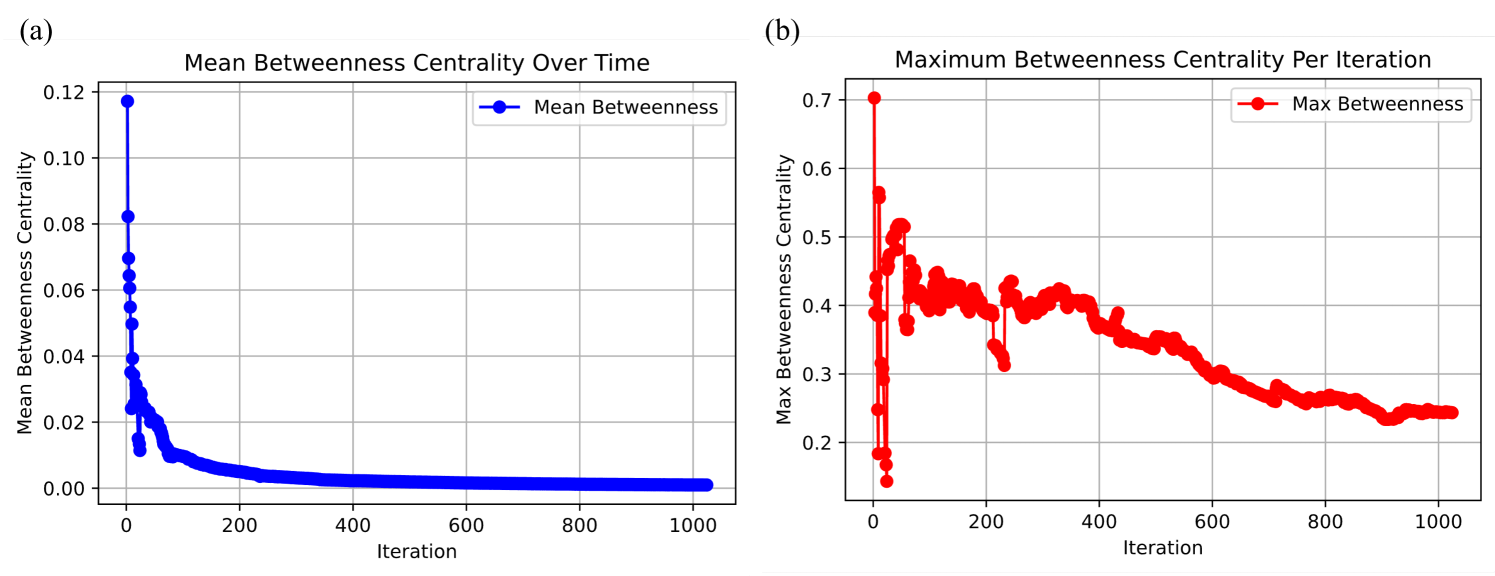
The image contains two line graphs labeled (a) and (b), depicting the evolution of betweenness centrality metrics across 1,000 iterations. Graph (a) shows the **mean betweenness centrality**, while graph (b) tracks the **maximum betweenness centrality**. Both graphs use iterations (0–1,000) on the x-axis and centrality values (0.00–0.12 for mean, 0.00–0.70 for max) on the y-axis.
### Components/Axes
- **Graph (a): Mean Betweenness Centrality Over Time**
- **X-axis**: Iteration (0–1,000, linear scale).
- **Y-axis**: Mean Betweenness Centrality (0.00–0.12, linear scale).
- **Legend**: Blue line labeled "Mean Betweenness" (top-right corner).
- **Data Points**: Blue dots connected by a line.
- **Graph (b): Maximum Betweenness Centrality Per Iteration**
- **X-axis**: Iteration (0–1,000, linear scale).
- **Y-axis**: Max Betweenness Centrality (0.00–0.70, linear scale).
- **Legend**: Red line labeled "Max Betweenness" (top-right corner).
- **Data Points**: Red dots connected by a line.
### Detailed Analysis
#### Graph (a): Mean Betweenness Centrality
- **Initial Drop**: At iteration 0, the mean centrality starts at ~0.12. It sharply declines to ~0.08 by iteration 50, then gradually decreases to ~0.005 by iteration 1,000.
- **Stabilization**: After iteration 200, the mean centrality plateaus near 0.00, with minimal fluctuations.
#### Graph (b): Maximum Betweenness Centrality
- **Initial Peak**: At iteration 0, the maximum centrality begins at ~0.70.
- **Fluctuations**: Between iterations 50–500, the value oscillates between ~0.50 and ~0.30, with a notable dip to ~0.20 at iteration 200.
- **Gradual Decline**: From iteration 500 onward, the maximum centrality steadily decreases to ~0.20 by iteration 1,000.
### Key Observations
1. **Graph (a)**: The mean centrality drops rapidly in early iterations, suggesting a homogenization of node influence over time.
2. **Graph (b)**: The maximum centrality remains higher than the mean throughout, indicating persistent "hub" nodes even as overall centrality declines.
3. **Divergence**: The gap between mean and max centrality widens initially but narrows as iterations progress, implying reduced variability in node influence.
### Interpretation
- **Network Dynamics**: The sharp decline in mean centrality (graph a) suggests that early iterations involve significant structural changes (e.g., node additions/removals or edge rewiring), while later iterations stabilize.
- **Persistent Hubs**: The sustained maximum centrality (graph b) implies that certain nodes retain disproportionate influence despite overall network stabilization. This could reflect resilient core structures or critical nodes in the system.
- **Anomalies**: The dip in maximum centrality at iteration 200 (graph b) may correspond to a temporary disruption (e.g., a hub node’s temporary disconnection) before recovery.
The data collectively highlights a transition from a highly variable, hub-dominated network to a more uniform structure with diminished centrality extremes.