## Bar Chart: Test Accuracy vs. Depth Variation
### Overview
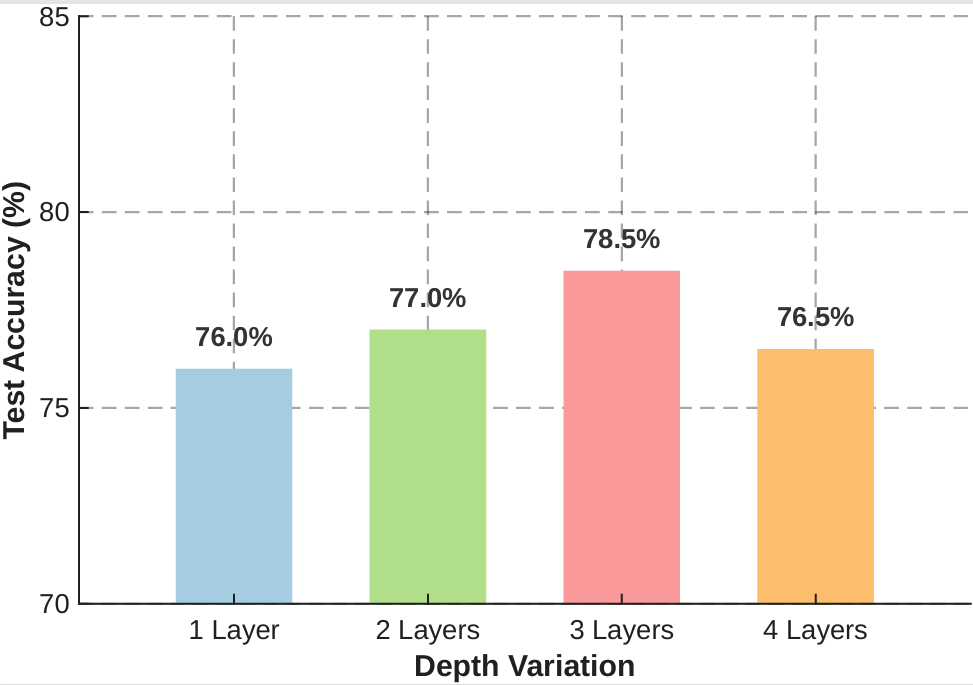
The image is a bar chart illustrating the relationship between the depth of a model (measured in the number of layers) and its resulting test accuracy. The chart demonstrates a non-monotonic relationship, where accuracy increases as layers are added up to a certain point, followed by a decline.
### Components/Axes
* **Y-Axis (Vertical):** Labeled "Test Accuracy (%)". The scale ranges from 70 to 85, with major grid lines marked at 70, 75, 80, and 85.
* **X-Axis (Horizontal):** Labeled "Depth Variation". It contains four discrete categories: "1 Layer", "2 Layers", "3 Layers", and "4 Layers".
* **Data Series:** Four vertical bars, each corresponding to a specific depth category.
* **1 Layer:** Light blue bar.
* **2 Layers:** Light green bar.
* **3 Layers:** Light red/salmon bar.
* **4 Layers:** Light orange bar.
### Detailed Analysis
The trend shows an initial upward trajectory in accuracy as the number of layers increases from 1 to 3, followed by a downward trend when moving to 4 layers.
* **1 Layer (Blue):** The bar reaches a height of **76.0%**.
* **2 Layers (Green):** The bar reaches a height of **77.0%**, representing a 1.0 percentage point increase over the 1-layer model.
* **3 Layers (Red):** The bar reaches a height of **78.5%**, representing the peak accuracy in the dataset. This is a 1.5 percentage point increase over the 2-layer model.
* **4 Layers (Orange):** The bar reaches a height of **76.5%**, representing a 2.0 percentage point decrease from the 3-layer model.
### Key Observations
* **Optimal Depth:** The 3-layer configuration provides the highest test accuracy (78.5%).
* **Performance Drop:** There is a notable performance degradation when increasing the depth from 3 layers to 4 layers.
* **Relative Performance:** The 4-layer model (76.5%) performs worse than the 2-layer model (77.0%) but still outperforms the baseline 1-layer model (76.0%).
### Interpretation
This data suggests a classic "sweet spot" in model architecture design. In machine learning, increasing the depth of a model (adding layers) typically allows the model to learn more complex features. However, the data demonstrates that this benefit is not infinite.
The drop in accuracy at 4 layers suggests that the model may be encountering issues such as:
1. **Overfitting:** The model is becoming too complex for the provided dataset, capturing noise rather than signal.
2. **Optimization Difficulties:** The model may be suffering from vanishing gradients or other training instabilities associated with deeper architectures, preventing it from converging as effectively as the 3-layer version.
From a technical standpoint, this chart serves as evidence that "deeper is not always better." It justifies the selection of a 3-layer architecture as the optimal configuration for this specific task, as it balances complexity and performance effectively.