## Bar Chart: Test Accuracy (%) by Depth Variation
### Overview
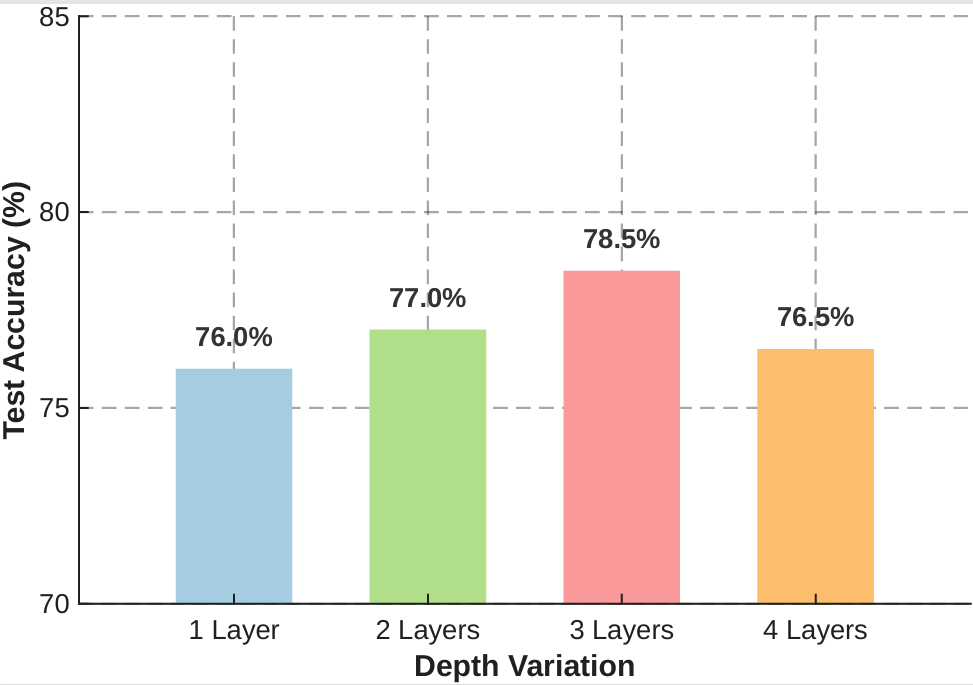
The chart compares test accuracy percentages across neural network architectures with varying depths (1 to 4 layers). Accuracy is measured on a y-axis from 70% to 85%, with four distinct bars representing different layer configurations.
### Components/Axes
- **X-axis (Depth Variation)**: Categorical axis labeled "1 Layer," "2 Layers," "3 Layers," and "4 Layers."
- **Y-axis (Test Accuracy %)**: Numerical axis ranging from 70% to 85% in 1% increments.
- **Legend**: Located on the right side of the chart, associating colors with layer configurations:
- Blue: 1 Layer
- Green: 2 Layers
- Red: 3 Layers
- Orange: 4 Layers
- **Bars**: Four vertical bars with explicit percentage labels:
- 1 Layer: 76.0% (blue)
- 2 Layers: 77.0% (green)
- 3 Layers: 78.5% (red)
- 4 Layers: 76.5% (orange)
### Detailed Analysis
- **1 Layer**: Blue bar at 76.0%, the lowest accuracy among all configurations.
- **2 Layers**: Green bar at 77.0%, showing a 1.0% improvement over 1 layer.
- **3 Layers**: Red bar at 78.5%, the highest accuracy, representing a 1.5% increase from 2 layers.
- **4 Layers**: Orange bar at 76.5%, a 2.0% drop from the 3-layer configuration, returning to near 1-layer performance.
### Key Observations
1. **Optimal Depth**: 3-layer networks achieve peak accuracy (78.5%), outperforming all other configurations.
2. **Diminishing Returns**: Adding a fourth layer reduces accuracy by 2.0%, suggesting overfitting or architectural inefficiency.
3. **Color Consistency**: Legend colors (blue, green, red, orange) unambiguously map to their respective layer counts without overlap.
### Interpretation
The data demonstrates a clear non-linear relationship between network depth and test accuracy. While increasing layers from 1 to 3 improves performance, the subsequent drop at 4 layers implies that deeper architectures may introduce complexity without proportional benefits. This pattern aligns with common machine learning principles where optimal model complexity balances bias and variance. The 3-layer configuration represents a Pareto-efficient solution, achieving maximum accuracy with minimal layers. The color-coding enhances interpretability, though the absence of error bars or confidence intervals limits understanding of result reliability.