## Scatter Plot: Projection of Activations on τ<sub>G</sub> and τ<sub>p</sub>
### Overview
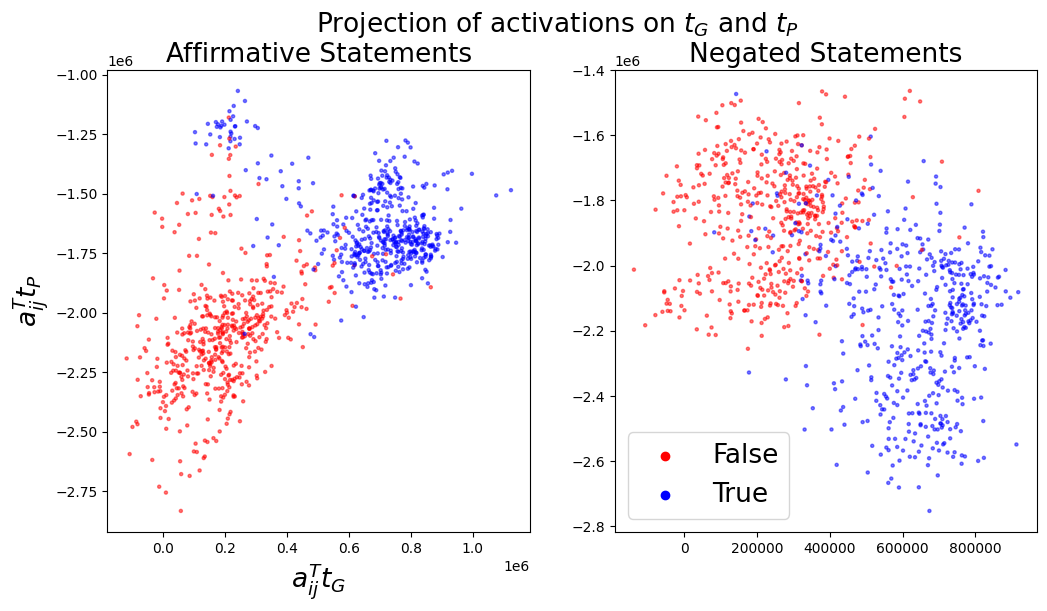
The image presents two scatter plots, side-by-side, visualizing the projection of activations onto two parameters, τ<sub>G</sub> and τ<sub>p</sub>. The left plot displays data for "Affirmative Statements," while the right plot shows data for "Negated Statements." Each point in the scatter plots represents a data instance, colored to indicate whether it is "True" or "False."
### Components/Axes
* **Title:** "Projection of activations on τ<sub>G</sub> and τ<sub>p</sub>" (centered at the top)
* **Left Plot Title:** "Affirmative Statements" (top-left)
* **Right Plot Title:** "Negated Statements" (top-right)
* **X-axis Label (Both Plots):** a<sub>ij</sub>τ<sub>G</sub>
* **Y-axis Label (Left Plot):** a<sub>ij</sub>τ<sub>p</sub>
* **Y-axis Label (Right Plot):** a<sub>ij</sub>τ<sub>p</sub>
* **Legend (Bottom-Right):**
* Red Circle: False
* Blue Circle: True
* **X-axis Scale (Left Plot):** Approximately 0 to 1,000,000 (1e6)
* **Y-axis Scale (Left Plot):** Approximately -2.8 to -1.0 (1e6)
* **X-axis Scale (Right Plot):** Approximately 0 to 800,000
* **Y-axis Scale (Right Plot):** Approximately -2.8 to -1.6 (1e6)
### Detailed Analysis or Content Details
**Left Plot (Affirmative Statements):**
* **True (Blue):** The blue points form a roughly diagonal band extending from the bottom-left to the top-right. The points are concentrated around x = 0.8e6 and y = -1.25e6, with a spread in both directions. The density of points appears to decrease as you move away from this central band.
* **False (Red):** The red points are more dispersed, forming a cloud concentrated in the bottom-left corner. The points are generally below y = -2.0e6 and to the left of x = 0.4e6.
* **Approximate Data Points (True):**
* (0.0, -2.7)
* (0.2e6, -2.5e6)
* (0.4e6, -2.3e6)
* (0.6e6, -2.1e6)
* (0.8e6, -1.9e6)
* (1.0e6, -1.7e6)
* **Approximate Data Points (False):**
* (0.0, -2.7)
* (0.2e6, -2.6e6)
* (0.4e6, -2.4e6)
**Right Plot (Negated Statements):**
* **True (Blue):** The blue points form a diagonal band extending from the bottom-left to the top-right. The points are concentrated around x = 600,000 and y = -2.0e6, with a spread in both directions.
* **False (Red):** The red points are more dispersed, forming a cloud concentrated in the bottom-left corner. The points are generally below y = -2.4e6 and to the left of x = 200,000.
* **Approximate Data Points (True):**
* (0, -2.7)
* (200000, -2.5)
* (400000, -2.3)
* (600000, -2.1)
* (800000, -1.9)
* **Approximate Data Points (False):**
* (0, -2.7)
* (100000, -2.6)
* (200000, -2.5)
### Key Observations
* In both plots, the "True" data points tend to cluster along a diagonal, suggesting a positive correlation between τ<sub>G</sub> and τ<sub>p</sub> for true statements (both affirmative and negated).
* The "False" data points are more scattered, indicating a weaker or non-existent correlation.
* The range of τ<sub>G</sub> values is significantly different between the two plots. The affirmative statements have a much larger range (up to 1,000,000) than the negated statements (up to 800,000).
* The separation between the "True" and "False" clusters appears more distinct in the "Negated Statements" plot than in the "Affirmative Statements" plot.
### Interpretation
The plots demonstrate how activations project onto the parameters τ<sub>G</sub> and τ<sub>p</sub> for both affirmative and negated statements. The clustering of "True" statements along a diagonal suggests that these statements exhibit a consistent relationship between these parameters. The more scattered distribution of "False" statements indicates that they do not follow the same pattern.
The difference in the range of τ<sub>G</sub> values between the two plots could indicate that the underlying mechanisms or representations used for affirmative and negated statements are different. The clearer separation between "True" and "False" in the negated statements plot might suggest that negation introduces a more distinct pattern in the activation space, making it easier to differentiate between true and false statements.
This visualization could be used to understand how a model represents and processes logical statements, and to identify potential areas for improvement in its reasoning capabilities. The parameters τ<sub>G</sub> and τ<sub>p</sub> likely represent some internal features or representations learned by the model, and their projection onto these parameters provides insights into the model's internal workings.