## Scatter Plots: Projection of activations on t_G and t_P
### Overview
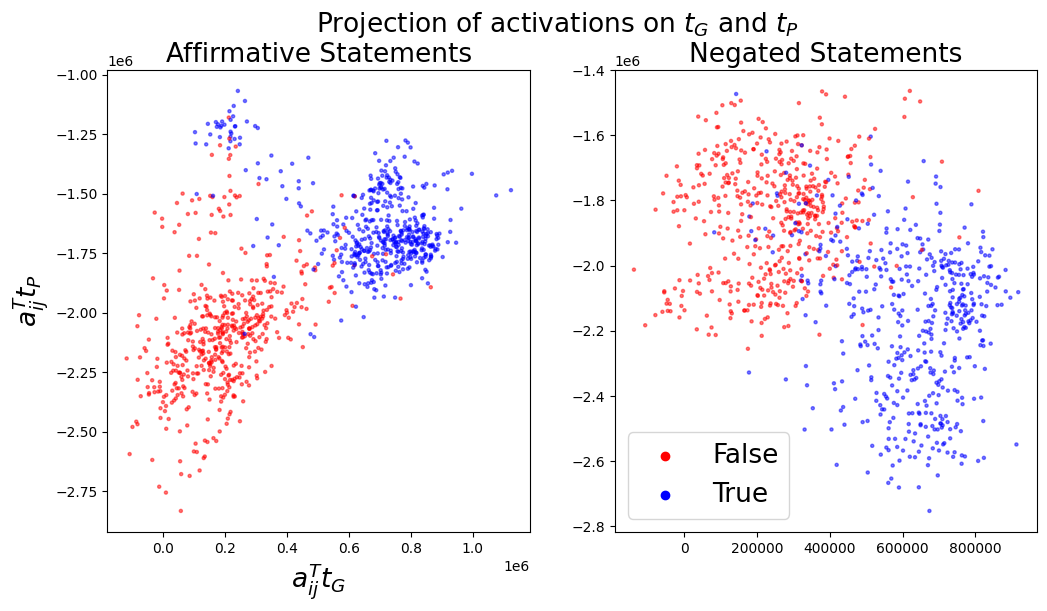
Two scatter plots compare the projection of activations on two variables, **t_G** (likely "ground truth") and **t_P** (likely "predicted"), for **affirmative** and **negated statements**. Points are color-coded: **red** for "False" and **blue** for "True".
### Components/Axes
- **Left Plot (Affirmative Statements)**:
- **X-axis**: `a_ij^T t_G` (range: 0 to 1.0e6)
- **Y-axis**: `a_ij^T t_P` (range: -2.75e6 to -1.0e6)
- **Legend**: Red = False, Blue = True (bottom-right corner)
- **Right Plot (Negated Statements)**:
- **X-axis**: `a_ij^T t_G` (range: 0 to 800,000)
- **Y-axis**: `a_ij^T t_P` (range: -2.8e6 to -1.4e6)
- **Legend**: Red = False, Blue = True (bottom-right corner)
### Detailed Analysis
#### Left Plot (Affirmative Statements)
- **Red Points (False)**:
- Clustered in the **lower-left quadrant** (x: 0–0.4e6, y: -2.75e6 to -2.0e6).
- Density decreases as x increases.
- **Blue Points (True)**:
- Concentrated in the **upper-right quadrant** (x: 0.4e6–1.0e6, y: -1.5e6 to -1.0e6).
- Slight overlap with red points near x ≈ 0.4e6.
#### Right Plot (Negated Statements)
- **Red Points (False)**:
- Dominant in the **upper-left quadrant** (x: 0–400,000, y: -2.2e6 to -1.6e6).
- Spreads sparsely toward the center.
- **Blue Points (True)**:
- Clustered in the **lower-right quadrant** (x: 400,000–800,000, y: -2.4e6 to -1.8e6).
- Higher density near x ≈ 600,000.
### Key Observations
1. **Affirmative Statements**:
- True (blue) points occupy higher values of both `a_ij^T t_G` and `a_ij^T t_P` compared to False (red).
- Clear separation between red and blue clusters.
2. **Negated Statements**:
- True (blue) points are shifted to lower `a_ij^T t_P` values but higher `a_ij^T t_G` compared to False (red).
- Overlap between red and blue points is more pronounced than in the affirmative plot.
3. **Axis Ranges**:
- The y-axis for negated statements extends further downward (-2.8e6 vs. -2.75e6), suggesting larger negative projections for negated statements.
### Interpretation
- **Model Behavior**:
- For **affirmative statements**, the model’s activations (`a_ij^T`) project more positively onto `t_P` (predicted) when the statement is True (blue), indicating alignment between prediction and ground truth.
- For **negated statements**, True (blue) points show a trade-off: higher `t_G` projections but lower `t_P` projections, suggesting the model struggles to maintain consistency when statements are negated.
- **Outliers/Anomalies**:
- A few red points in the affirmative plot (upper-right) and blue points in the negated plot (upper-left) deviate from the main clusters, potentially indicating misclassifications or edge cases.
- **Implications**:
- The separation in affirmative statements suggests the model reliably distinguishes True/False in this context.
- The overlap in negated statements highlights potential ambiguity or sensitivity to negation in the model’s processing.
### Spatial Grounding
- **Legend**: Positioned in the **bottom-right corner** of the right plot, with red (False) above blue (True).
- **Data Points**:
- Affirmative plot: Red (False) dominates lower-left; blue (True) upper-right.
- Negated plot: Red (False) upper-left; blue (True) lower-right.
### Content Details
- **Numerical Ranges**:
- Affirmative `a_ij^T t_G`: 0–1.0e6
- Affirmative `a_ij^T t_P`: -2.75e6 to -1.0e6
- Negated `a_ij^T t_G`: 0–800,000
- Negated `a_ij^T t_P`: -2.8e6 to -1.4e6
### Final Notes
The plots reveal how negation impacts the model’s activation projections, with True/False distributions shifting spatially. This could inform adjustments to handle negated statements more robustly.