## Star Chart: Moon and Constellations
### Overview
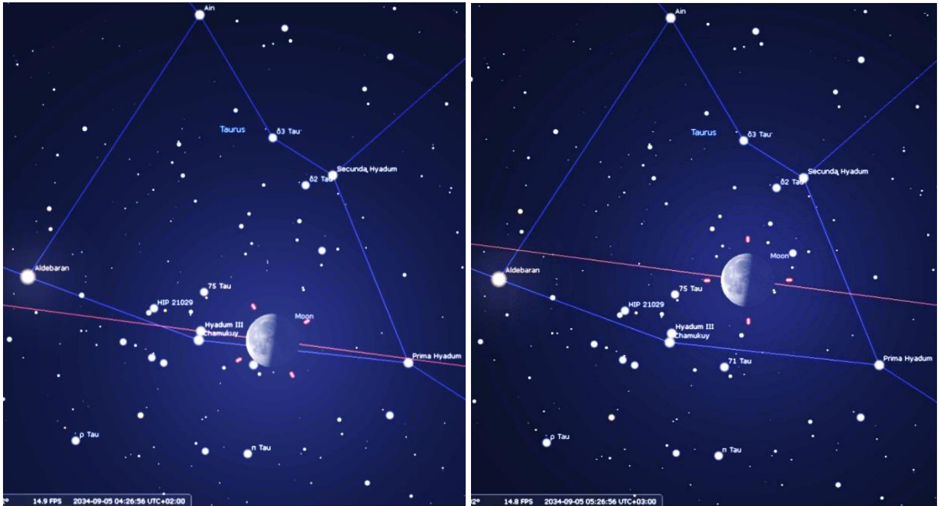
The image presents two star charts depicting the moon's position relative to constellations and stars at different times. The charts share a similar layout, with constellations outlined by blue lines and individual stars marked with white dots and labels. The moon is prominently displayed, and a red line appears to indicate its path or a celestial alignment. The two charts differ slightly in the moon's position and the timestamp at the bottom.
### Components/Axes
* **Constellations:** Taurus is labeled.
* **Stars:** Aldebaran, Ain, 63 Tau, 62 Tau, 75 Tau, 71 Tau, p Tau, n Tau, HIP 21029, Secunda Hyadum, Prima Hyadum, Hyadum III Chamukuy are labeled.
* **Celestial Body:** Moon is labeled.
* **Lines:** Blue lines connect stars to form constellations. A red line crosses the chart, possibly indicating the ecliptic or a specific alignment.
* **Timestamp (Bottom-Left):** 14.9 FPS 2034-09-05 04:26:56 UTC+02:00 (Left Image)
* **Timestamp (Bottom-Right):** 14.8 FPS 2034-09-05 05:26:56 UTC+03:00 (Right Image)
### Detailed Analysis
**Left Image:**
* The moon is positioned slightly to the right of Hyadum III Chamukuy and below 75 Tau.
* The red line passes just below the moon.
* The timestamp indicates a time of 04:26:56 UTC+02:00 on September 5, 2034.
**Right Image:**
* The moon is positioned slightly to the right of its position in the left image.
* The red line passes just below the moon.
* The timestamp indicates a time of 05:26:56 UTC+03:00 on September 5, 2034.
### Key Observations
* The primary difference between the two charts is the moon's position, which has shifted slightly to the right in the right image, indicating its movement over the course of one hour.
* The timestamps at the bottom of each image confirm the one-hour time difference.
* The constellations and stars remain in the same relative positions in both images.
### Interpretation
The images demonstrate the moon's movement relative to fixed stars and constellations over a one-hour period. The charts provide a visual representation of celestial mechanics, showing how the moon's position changes against the backdrop of the night sky. The red line likely represents the ecliptic, the apparent path of the sun across the celestial sphere, which is closely related to the moon's orbit. The charts could be used for educational purposes or for astronomical observation planning. The slight change in the moon's position highlights the continuous motion of celestial bodies.