\n
## Star Chart: Lunar Observation of Taurus Constellation
### Overview
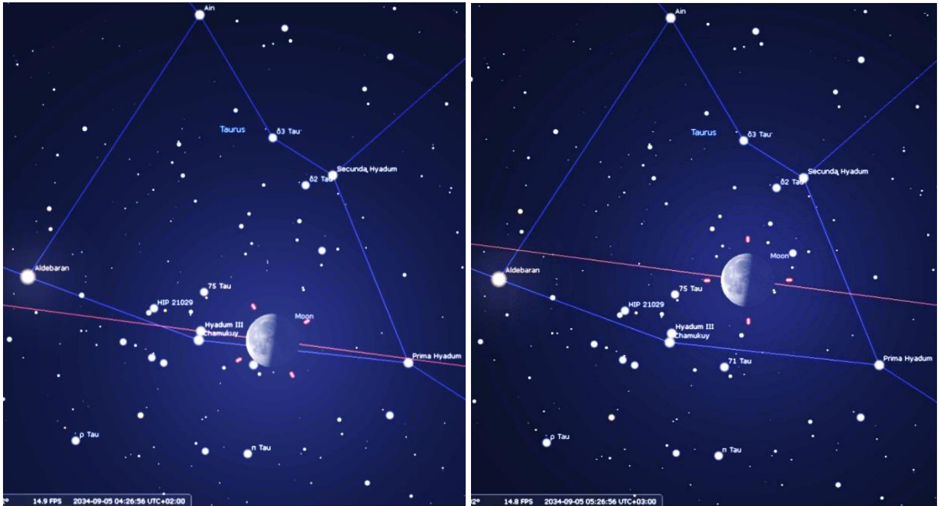
The image presents two star charts depicting the Taurus constellation with the Moon at different phases and positions. The charts appear to be simulations or screenshots from astronomical software, showing star positions, constellation lines, and the Moon's apparent movement. Both images share the same constellation layout but differ in the Moon's position and phase.
### Components/Axes
The charts do not have traditional axes. Instead, they display a starfield with labeled stars and constellation lines. Key components include:
* **Stars:** Represented as points of light with labels indicating their names (e.g., Aldebaran, Ain, Tau).
* **Constellation Lines:** Blue lines connecting stars to define the Taurus constellation.
* **Moon:** Represented as a shaded circle, with varying phases in each image.
* **Labels:** Text annotations identifying stars and other celestial objects.
* **Timestamp:** Located at the bottom-left corner, indicating the date and time of the simulation.
### Detailed Analysis or Content Details
**Image 1 (Left):**
* **Timestamp:** 2024-09-05 04:26:34 UTC+0:00, 14.9 FPS
* **Stars:**
* Aldebaran: Located in the bottom-left, labeled.
* Ain: Located at the top, labeled.
* Taurus: Labeled near the top-center.
* 03 Tau: Labeled near the top-center.
* 62 Tau: Labeled near the top-right.
* Secunda Hyadum: Labeled near the top-right.
* 75 Tau: Labeled near the center-left.
* Hyadum III Chamakuy: Labeled near the center-left.
* HIP 21009: Labeled near the center-left.
* Prima Hyadum: Labeled near the bottom-right.
* 0 Tau: Located at the bottom-left, labeled.
* n Tau: Located at the bottom-left, labeled.
* **Moon:** Positioned in the center-right, appearing as a crescent moon (approximately 60% illuminated).
**Image 2 (Right):**
* **Timestamp:** 2024-09-05 05:26:36 UTC+0:00, 14.9 FPS
* **Stars:** Same star labels as Image 1.
* **Moon:** Positioned slightly higher and to the right compared to Image 1, appearing as a gibbous moon (approximately 85% illuminated). The moon is significantly brighter and larger in this image.
### Key Observations
* The Moon's position changes between the two images, indicating its movement across the sky over approximately one hour (based on the timestamps).
* The Moon's phase progresses from a crescent to a gibbous, indicating the passage of time.
* The starfield remains constant between the two images, serving as a fixed reference frame.
* The timestamps indicate a frame rate of 14.9 FPS.
### Interpretation
The images demonstrate the apparent motion of the Moon against the backdrop of fixed stars. The change in the Moon's position and phase over a one-hour period illustrates the Earth's rotation and the Moon's orbit around the Earth. The star chart provides a visual representation of the celestial sphere, allowing for the identification of stars and constellations. The simulation accurately depicts the relative positions of celestial objects at specific times. The difference in the Moon's illumination suggests the progression of its lunar cycle. The images are likely used for educational purposes or astronomical observation planning. The consistent starfield confirms the use of a fixed coordinate system for the simulation.