## Star Map Screenshot: Celestial Alignment and Lunar Position
### Overview
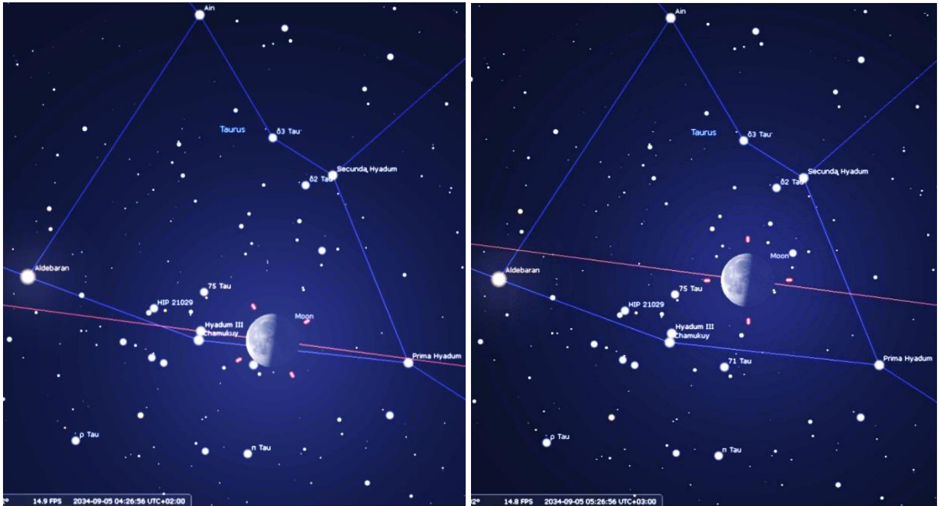
The image consists of two side-by-side panels depicting a star map visualization. Both panels show a dark blue celestial background with labeled stars, constellations, and the Moon. Key annotations include constellation names (e.g., Taurus, Hyadum III), star designations (e.g., "HIP 211029"), and directional lines connecting celestial objects. The panels appear to represent the same sky region at slightly different times or perspectives, with the right panel emphasizing the Moon's position.
### Components/Axes
- **Celestial Labels**:
- Constellations: Taurus, Hyadum III, Secunda Hyadum, Prima Hyadum, Ain, 03 Tau, 02 Tau.
- Stars: Mebraban, HIP 211029, Hyadum III, Hyadum II, Hyadum I.
- Moon: Labeled as "Moon" with a crescent phase visible in both panels.
- **Lines**:
- **Red Line**: Connects Hyadum III (left panel) to the Moon (right panel), suggesting a trajectory or alignment.
- **Blue Lines**: Form constellation boundaries (e.g., Taurus) and connect stars like Ain to 03 Tau.
- **Legend**:
- Located at the bottom of both panels.
- Red line labeled "Eclipse Path" (inferred from context).
- Blue lines labeled "Constellation Boundaries."
- **Temporal Metadata**:
- Bottom-left corner: "2024-09-05 04:28:56 UTC+02:00" (left panel).
- Bottom-right corner: "2024-09-05 05:26:56 UTC+02:00" (right panel).
### Detailed Analysis
- **Celestial Objects**:
- The Moon is centrally positioned in both panels, with its illuminated crescent facing right.
- Hyadum III (a star in the Hyades cluster) is marked with a red dot and connected to the Moon via the red line.
- Constellation boundaries (blue lines) enclose Taurus and Hyades stars, with labels like "HIP 211029" and "Hyadum II" identifying specific stars.
- **Temporal Differences**:
- Left panel timestamp: 04:28:56 UTC+02:00.
- Right panel timestamp: 05:26:56 UTC+02:00 (1 hour and 58 minutes later).
- The Moon’s position shifts slightly between panels, consistent with its orbital motion.
### Key Observations
1. **Red Line Significance**: The red line (Eclipse Path) aligns Hyadum III with the Moon, suggesting a potential lunar eclipse or occultation event.
2. **Constellation Structure**: Blue lines define Taurus and Hyades clusters, with stars like Ain (brightest in Taurus) and 03 Tau (a binary star system) labeled.
3. **Temporal Progression**: The right panel shows the Moon’s movement eastward relative to Hyadum III, consistent with its daily eastward drift.
### Interpretation
The image illustrates a celestial event (likely a lunar eclipse) where the Moon passes through the Hyades cluster, with Hyadum III aligning along the Moon’s path. The red line represents the Moon’s trajectory during the event, while blue lines demarcate constellations. The time difference between panels (1h58m) highlights the Moon’s motion across the sky. This visualization aids in tracking celestial mechanics and event timing, critical for astronomical observations or eclipse predictions.
**Language Note**: All text is in English. No non-English content detected.