## Line Chart: 10x10 Maze: Grid Ablation
### Overview
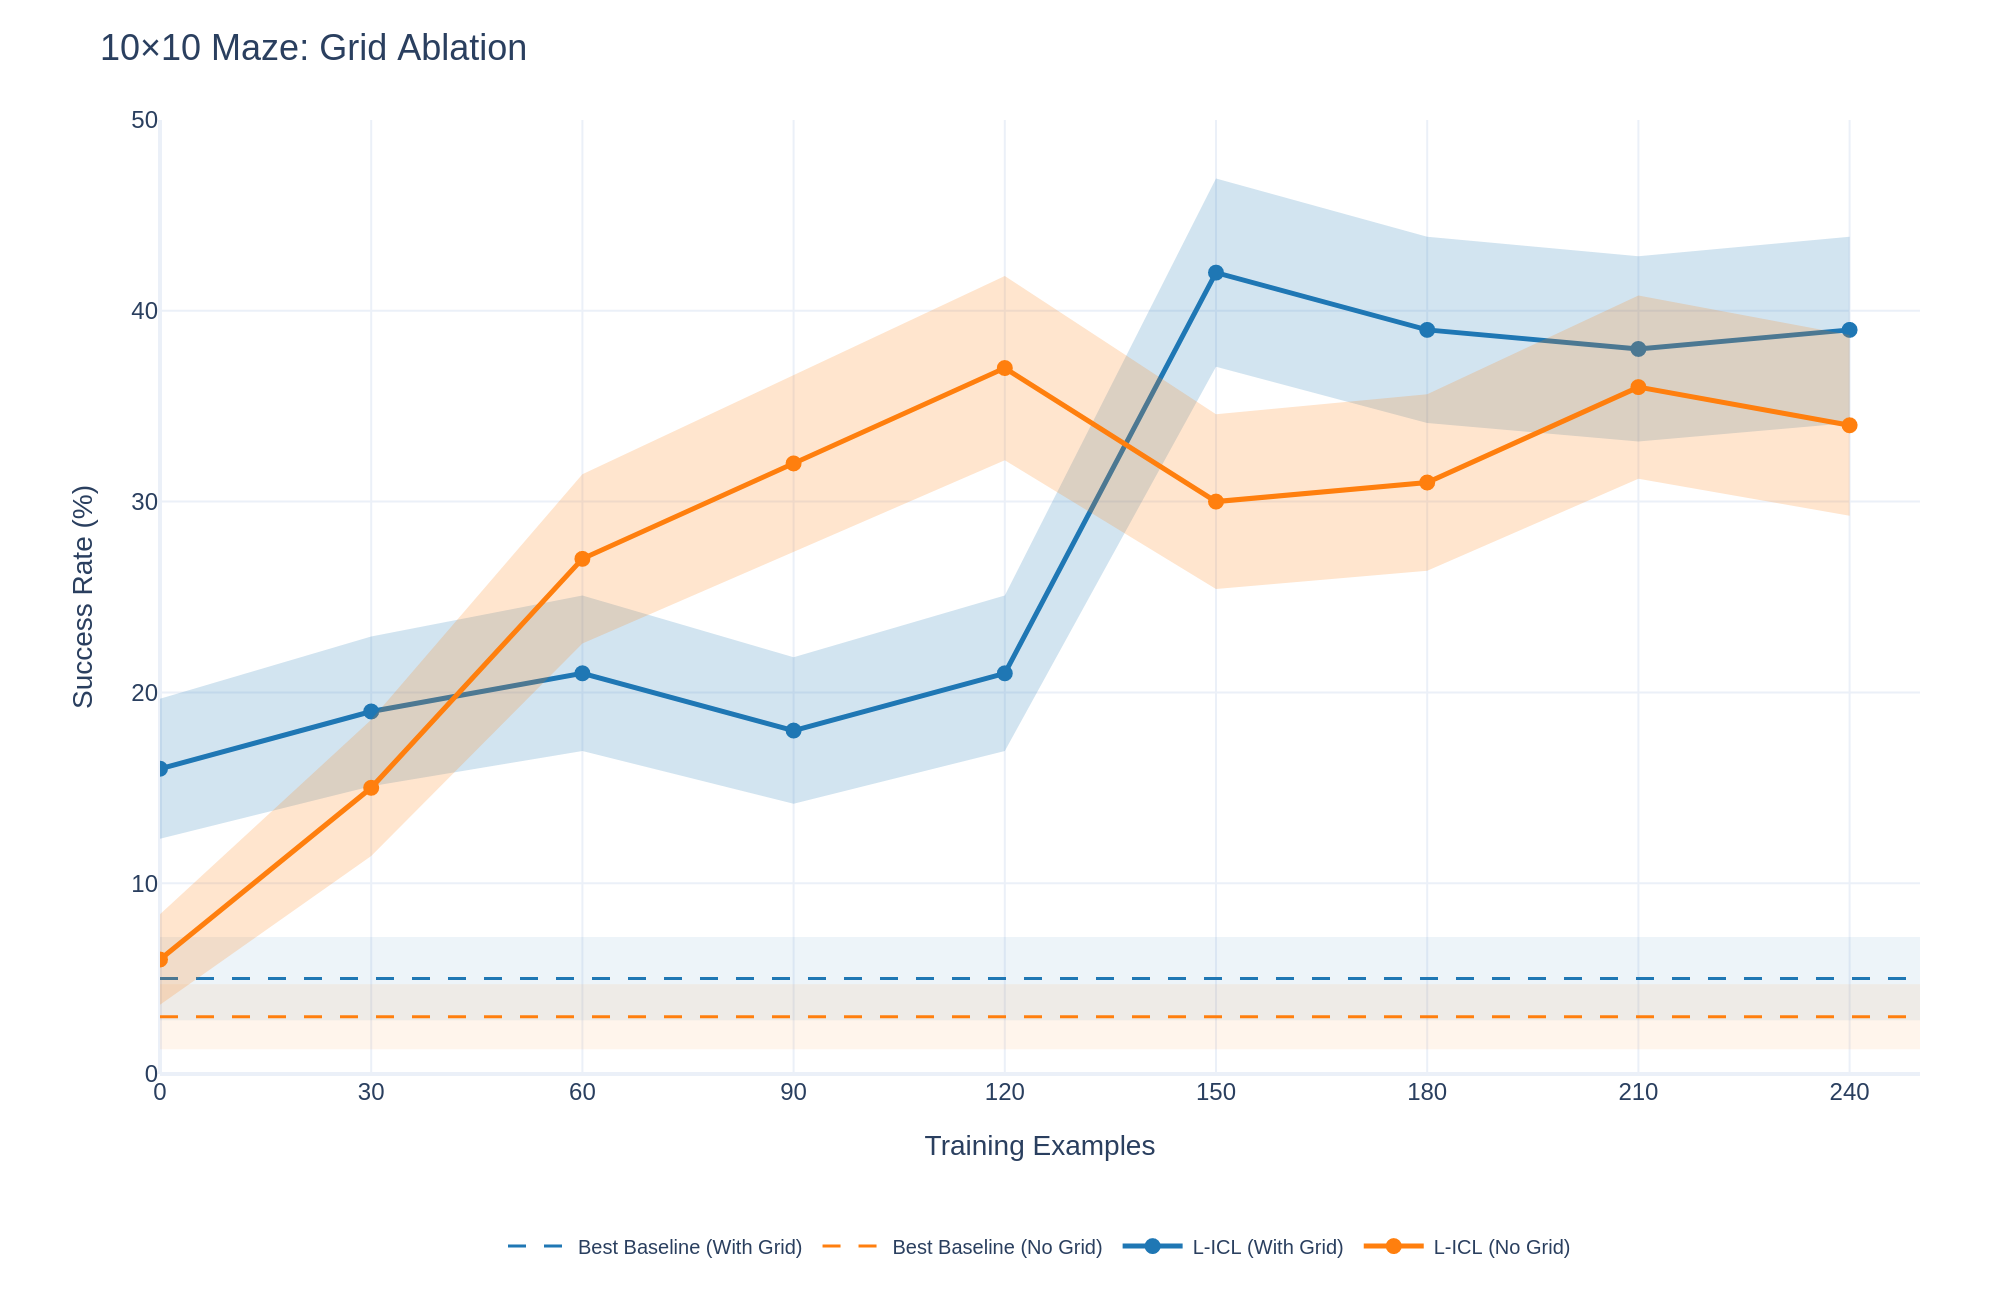
This line chart visualizes the performance of different models (Best Baseline, L-ICL) with and without a grid, as measured by Success Rate (%) against the number of Training Examples. The chart appears to be evaluating the impact of using a grid representation in a 10x10 maze solving task.
### Components/Axes
* **Title:** 10x10 Maze: Grid Ablation
* **X-axis:** Training Examples (ranging from 0 to 240, with markers at 0, 30, 60, 90, 120, 150, 180, 210, and 240)
* **Y-axis:** Success Rate (%) (ranging from 0 to 50, with markers at 0, 10, 20, 30, 40, and 50)
* **Legend:** Located at the bottom-right of the chart.
* Best Baseline (With Grid) - Dashed Blue Line
* Best Baseline (No Grid) - Dashed Orange Line
* L-ICL (With Grid) - Solid Blue Line
* L-ICL (No Grid) - Solid Orange Line
### Detailed Analysis
Let's analyze each line individually, noting trends and approximate data points.
* **Best Baseline (With Grid) - Dashed Blue Line:** This line starts at approximately 5% at 0 Training Examples and increases steadily to around 18% at 30 Training Examples. It continues to rise, reaching approximately 25% at 60 Training Examples, then plateaus around 25-30% between 90 and 180 Training Examples. Finally, it increases to approximately 35% at 210 Training Examples and remains around 35% at 240 Training Examples.
* **Best Baseline (No Grid) - Dashed Orange Line:** This line begins at approximately 5% at 0 Training Examples and decreases to around 3% at 30 Training Examples. It then rises to approximately 15% at 60 Training Examples, before decreasing to around 10% at 90 Training Examples. It remains relatively flat around 10-12% between 120 and 240 Training Examples.
* **L-ICL (With Grid) - Solid Blue Line:** This line starts at approximately 15% at 0 Training Examples and increases rapidly to around 35% at 30 Training Examples. It peaks at approximately 42% at 150 Training Examples, then decreases slightly to around 38% at 180 Training Examples, and remains around 38% at 210 and 240 Training Examples.
* **L-ICL (No Grid) - Solid Orange Line:** This line begins at approximately 8% at 0 Training Examples and increases to around 20% at 30 Training Examples. It reaches a peak of approximately 32% at 150 Training Examples, then decreases to around 30% at 180 Training Examples, and remains around 30-34% at 210 and 240 Training Examples.
### Key Observations
* The L-ICL model consistently outperforms the Best Baseline model, both with and without the grid.
* The grid appears to significantly improve the performance of the L-ICL model, especially at lower training example counts. The gap between L-ICL (With Grid) and L-ICL (No Grid) is substantial initially.
* The Best Baseline model shows minimal improvement from using the grid.
* All models exhibit diminishing returns in performance as the number of training examples increases beyond 150.
* The Best Baseline (No Grid) performs poorly, remaining below 15% success rate throughout the experiment.
### Interpretation
The data suggests that the L-ICL model is more effective at learning to solve the 10x10 maze task, and that the use of a grid representation significantly enhances its performance. The grid likely provides a more structured input format that the L-ICL model can leverage. The Best Baseline model, however, does not benefit as much from the grid, indicating that its learning process is less sensitive to the input representation. The plateauing of performance at higher training example counts suggests that the models are reaching their capacity to learn from the given data or that the task itself has a limited complexity. The consistently low performance of the Best Baseline (No Grid) indicates that it struggles to generalize from the training data without a structured input. This experiment demonstrates the importance of both model architecture (L-ICL vs. Best Baseline) and input representation (With Grid vs. No Grid) in achieving high performance on maze-solving tasks.