## Line Graph with Confidence Intervals: 10×10 Maze: Grid Ablation
### Overview
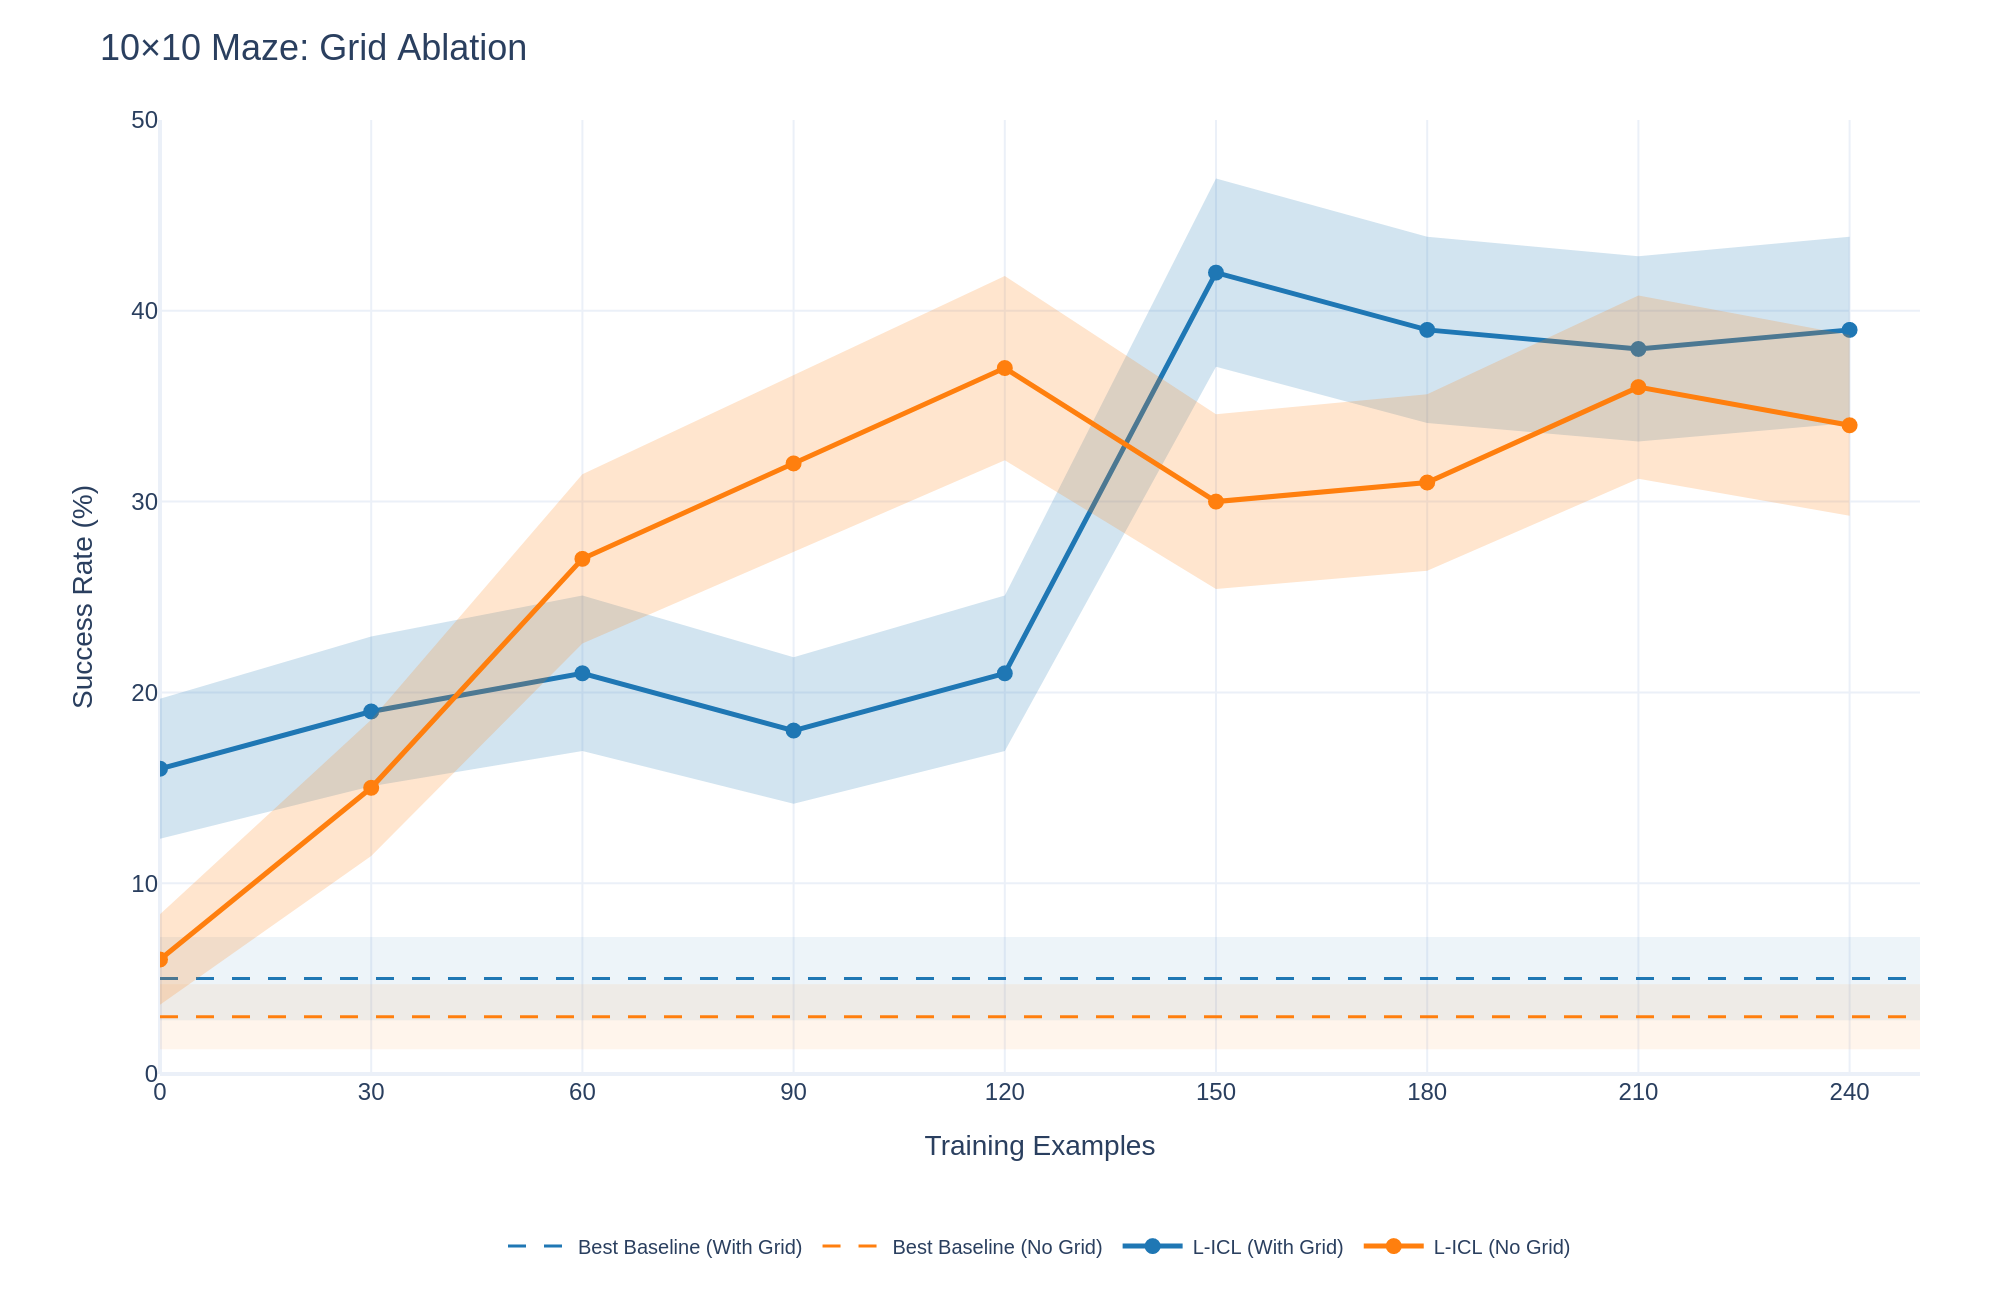
This image is a line graph titled "10×10 Maze: Grid Ablation." It plots the "Success Rate (%)" of different methods against the number of "Training Examples" used. The graph compares two main approaches (L-ICL and a Best Baseline) under two conditions each ("With Grid" and "No Grid"), showing both the mean performance (lines) and the variability (shaded confidence intervals).
### Components/Axes
* **Title:** "10×10 Maze: Grid Ablation" (top-left).
* **Y-Axis:** Labeled "Success Rate (%)". Scale runs from 0 to 50, with major tick marks at 0, 10, 20, 30, 40, and 50.
* **X-Axis:** Labeled "Training Examples". Scale runs from 0 to 240, with major tick marks at 0, 30, 60, 90, 120, 150, 180, 210, and 240.
* **Legend:** Located at the bottom center. It defines four data series:
1. `-- Best Baseline (With Grid)` (Blue dashed line)
2. `-- Best Baseline (No Grid)` (Orange dashed line)
3. `●- L-ICL (With Grid)` (Blue solid line with circle markers)
4. `●- L-ICL (No Grid)` (Orange solid line with circle markers)
* **Data Series & Shading:** Each solid line (L-ICL) is accompanied by a semi-transparent shaded area of the same color, representing the confidence interval or variance around the mean.
### Detailed Analysis
**1. Baseline Methods (Dashed Lines):**
* **Trend:** Both baseline methods show a flat, constant performance across all training example counts.
* **Values:**
* `Best Baseline (With Grid)`: Maintains a success rate of approximately **5%**.
* `Best Baseline (No Grid)`: Maintains a lower success rate of approximately **3%**.
**2. L-ICL (With Grid) - Blue Solid Line:**
* **Trend:** Shows a general upward trend with a notable, sharp increase between 120 and 150 training examples. After peaking, performance slightly declines and stabilizes.
* **Data Points (Approximate):**
* 0 examples: ~16%
* 30 examples: ~19%
* 60 examples: ~21%
* 90 examples: ~18% (a slight dip)
* 120 examples: ~21%
* **150 examples: ~42% (sharp peak)**
* 180 examples: ~39%
* 210 examples: ~38%
* 240 examples: ~39%
* **Confidence Interval (Blue Shading):** The interval is relatively narrow for lower training examples (0-120) but expands dramatically after the 150-example mark, indicating significantly higher variance in performance once the method achieves higher success rates.
**3. L-ICL (No Grid) - Orange Solid Line:**
* **Trend:** Shows a steady, strong upward trend until 120 examples, followed by a drop and then a more variable, fluctuating performance.
* **Data Points (Approximate):**
* 0 examples: ~6%
* 30 examples: ~15%
* 60 examples: ~27%
* 90 examples: ~32%
* **120 examples: ~37% (peak for this series)**
* 150 examples: ~30% (drop)
* 180 examples: ~31%
* 210 examples: ~36%
* 240 examples: ~34%
* **Confidence Interval (Orange Shading):** The interval widens as performance increases, showing growing variance, particularly after the 60-example mark.
### Key Observations
1. **L-ICL Superiority:** Both L-ICL variants dramatically outperform their respective baselines once trained on more than ~30 examples.
2. **Critical Threshold at 120-150 Examples:** The `L-ICL (With Grid)` method exhibits a phase-change-like jump in performance between 120 and 150 training examples, suggesting a possible critical data threshold for learning.
3. **Grid Information Impact:** The "With Grid" condition leads to a higher ultimate peak success rate (~42% vs. ~37%) but appears to require more data to trigger its major improvement. The "No Grid" condition learns more steadily initially but plateaus at a lower level and becomes less stable.
4. **Increased Variance with Performance:** For both L-ICL methods, higher success rates are correlated with wider confidence intervals, indicating that as the models become more capable, their performance becomes more sensitive to specific training examples or random seeds.
### Interpretation
This graph demonstrates the effectiveness of the L-ICL (likely "Learning with In-Context Learning") approach for solving 10x10 maze tasks compared to a static baseline. The core finding is that **L-ICL can learn to solve mazes from examples, and its performance is heavily influenced by both the quantity of training data and the presence of structural (grid) information.**
The data suggests a complex relationship:
* **Grid information acts as a powerful but potentially slower-to-learn scaffold.** It enables a higher performance ceiling but may require the model to first learn how to utilize the grid structure effectively, explaining the delayed but dramatic improvement.
* **Without grid information, the model learns a more direct but ultimately less optimal policy,** leading to faster initial gains that plateau earlier.
* The **high variance at higher performance levels** is a critical observation. It implies that while the L-ICL method is powerful, its success on any given maze instance may be unreliable, pointing to a need for methods that can reduce this variance, perhaps through ensemble techniques or more robust training.
In summary, the ablation study shows that for complex spatial reasoning tasks like maze-solving, **in-context learning is a viable paradigm, but its success is contingent on sufficient training data and is significantly enhanced by providing structured environmental cues (the grid), albeit with a trade-off in initial learning speed and final stability.**