## Line Chart: 10x10 Maze: Grid Ablation
### Overview
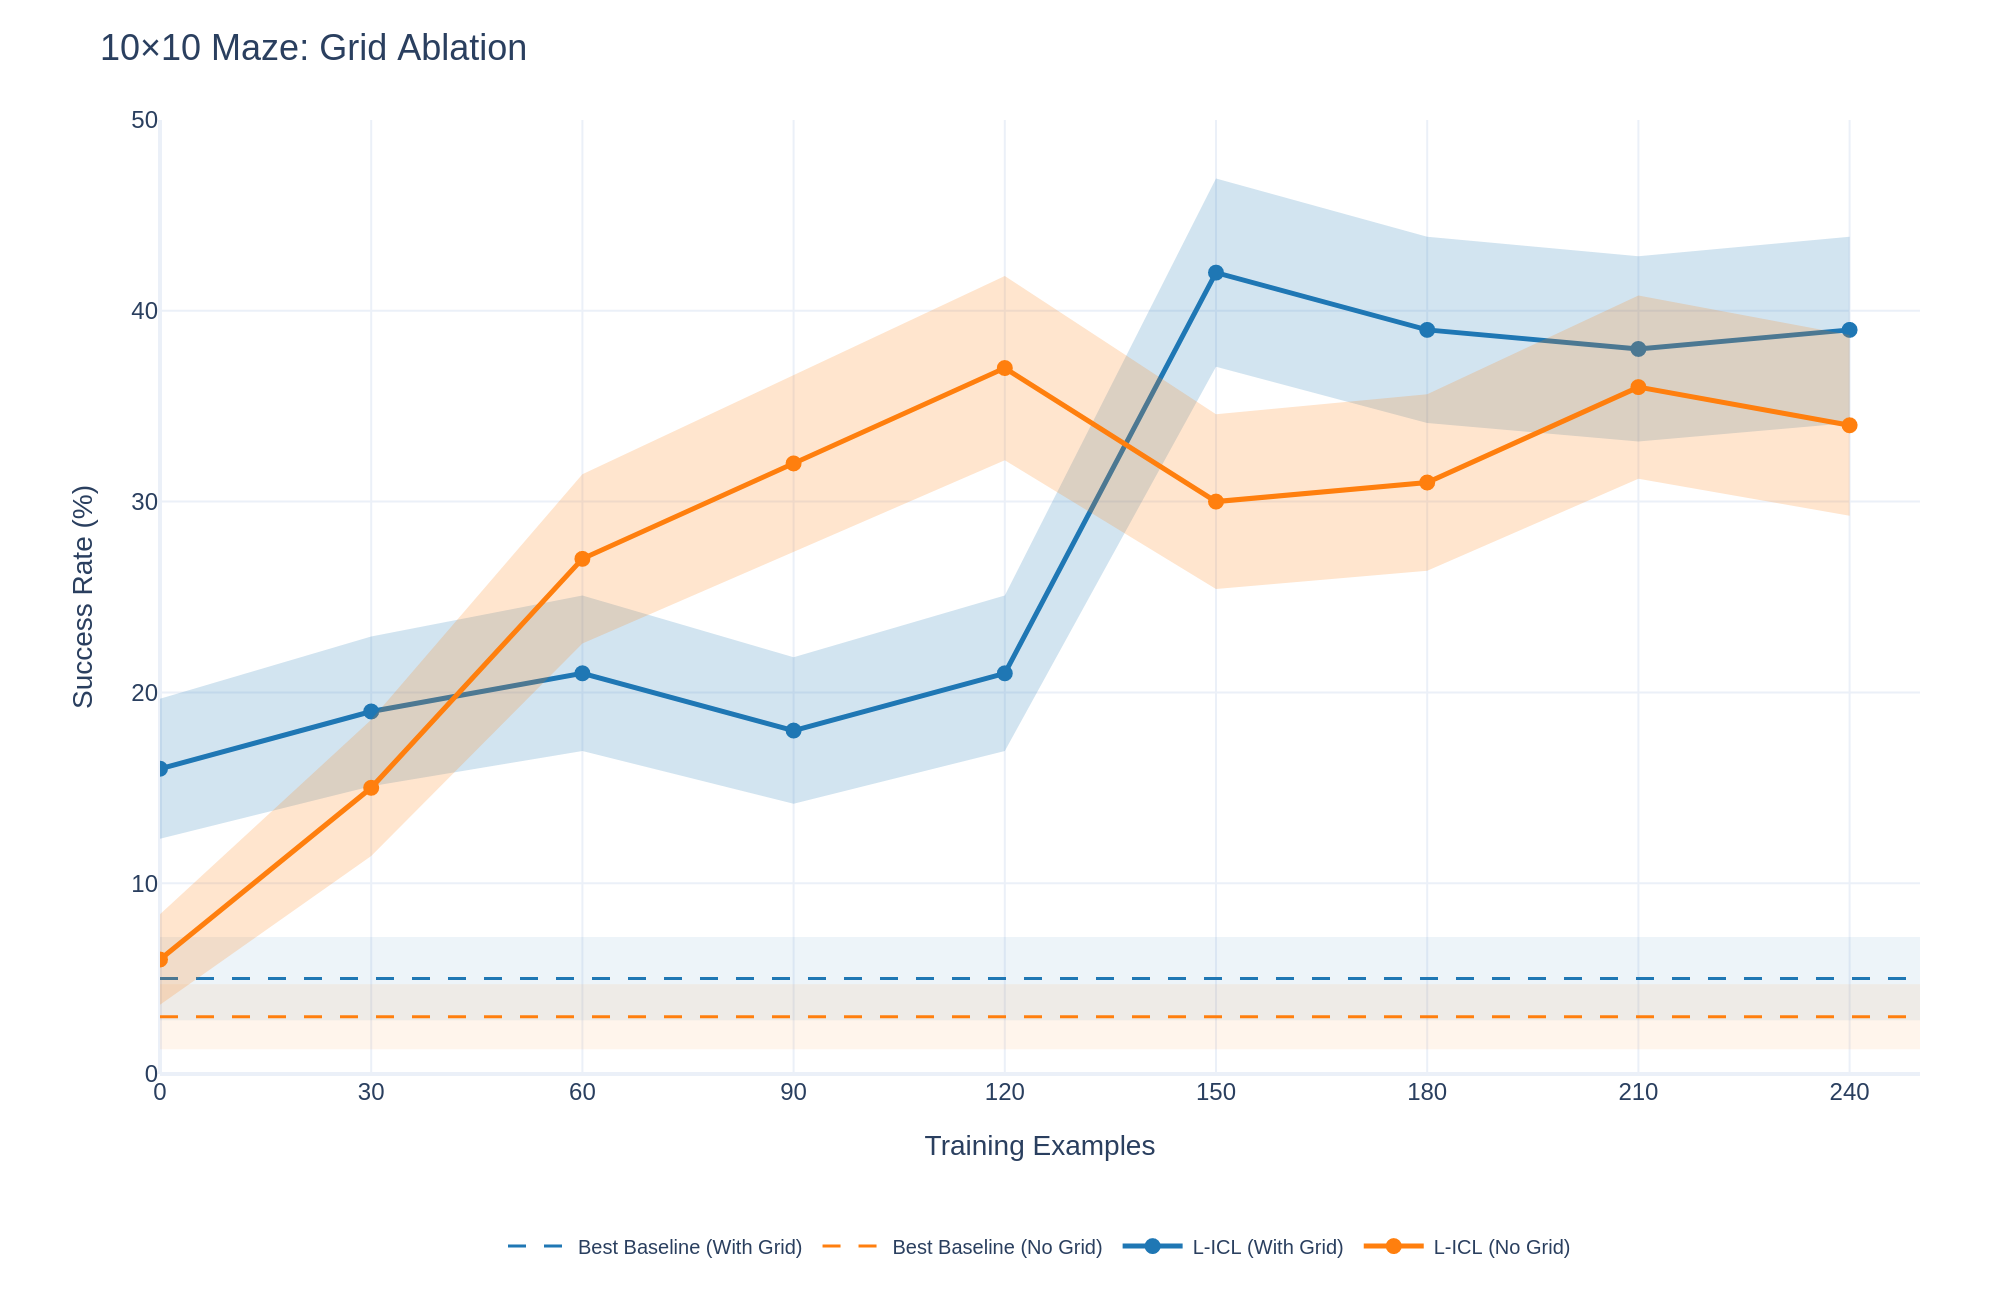
The chart visualizes the success rates of different maze-solving strategies across varying numbers of training examples. It compares two baseline methods ("Best Baseline") and two L-ICL variants, each tested with and without a grid structure. Success rates are plotted against training examples (0–240), with shaded regions indicating variability.
---
### Components/Axes
- **X-axis**: Training Examples (0, 30, 60, 90, 120, 150, 180, 210, 240)
- **Y-axis**: Success Rate (%) (0–50)
- **Legend**:
- Dashed blue: Best Baseline (With Grid)
- Dashed orange: Best Baseline (No Grid)
- Solid blue: L-ICL (With Grid)
- Solid orange: L-ICL (No Grid)
---
### Detailed Analysis
1. **Best Baseline (With Grid)**
- Starts at ~5% success rate at 0 training examples.
- Increases steadily to ~45% at 240 examples.
- Shaded region (confidence interval) narrows slightly as training progresses.
2. **Best Baseline (No Grid)**
- Starts at ~5% and rises to ~35% at 240 examples.
- Shaded region widens at lower training examples but stabilizes.
3. **L-ICL (With Grid)**
- Begins at ~15% and peaks at ~40% at 240 examples.
- Shaded region is the widest, indicating high variability.
4. **L-ICL (No Grid)**
- Starts at ~5% and reaches ~35% at 240 examples.
- Shaded region remains relatively consistent.
---
### Key Observations
- **Grid Impact**: All methods perform significantly better with a grid. For example, Best Baseline (With Grid) achieves 45% vs. 35% without a grid.
- **L-ICL Performance**: L-ICL (With Grid) underperforms Best Baseline (With Grid) at 240 examples (40% vs. 45%), suggesting the grid amplifies the effectiveness of simpler baselines.
- **Variability**: L-ICL (With Grid) shows the highest uncertainty (widest shaded region), while Best Baseline (With Grid) has the most stable results.
- **Convergence**: All methods plateau near 35–45% success rates at 240 examples, indicating diminishing returns with more training.
---
### Interpretation
1. **Grid Ablation Insights**:
- The grid structure is critical for success, as all methods show substantial improvements when grids are included.
- Best Baseline (With Grid) outperforms L-ICL (With Grid) at scale, implying that simpler heuristics may leverage grid structures more effectively than complex L-ICL models.
2. **L-ICL Limitations**:
- L-ICL (With Grid) exhibits higher variability, possibly due to overfitting or sensitivity to grid-specific patterns.
- Without a grid, L-ICL performs similarly to Best Baseline (No Grid), suggesting its advantages are grid-dependent.
3. **Practical Implications**:
- For grid-based mazes, prioritizing simpler baselines (e.g., Best Baseline) may yield more reliable results than complex L-ICL models.
- The grid’s role in structuring the problem space likely reduces the need for advanced reasoning in this context.
4. **Anomalies**:
- L-ICL (With Grid) underperforms Best Baseline (With Grid) despite its complexity, highlighting potential inefficiencies in the L-ICL approach for this task.
- The shaded regions for L-ICL (With Grid) suggest inconsistent training outcomes, warranting further investigation into model stability.