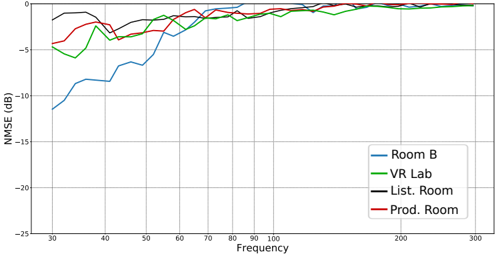
## Line Chart: NMSE vs. Frequency for Different Rooms
### Overview
The image is a line chart comparing the Normalized Mean Square Error (NMSE) in decibels (dB) against frequency for four different rooms: Room B, VR Lab, Listening Room, and Production Room. The chart shows how the NMSE changes with frequency for each room.
### Components/Axes
* **X-axis:** Frequency, ranging from 30 to 300. Axis markers are present at approximately 30, 40, 50, 60, 70, 80, 90, 100, 200, and 300.
* **Y-axis:** NMSE (dB), ranging from -25 to 0. Axis markers are present at 0, -5, -10, -15, -20, and -25.
* **Legend:** Located in the bottom-right corner, identifying the lines by color:
* Blue: Room B
* Green: VR Lab
* Black: List. Room (Listening Room)
* Red: Prod. Room (Production Room)
### Detailed Analysis
* **Room B (Blue):** The NMSE starts at approximately -11 dB at 30 Hz, increases sharply to about -8 dB at 40 Hz, then to -7 dB at 50 Hz, and then increases more gradually to approximately -2 dB at 70 Hz. It then plateaus around -1 dB to 0 dB from 80 Hz to 300 Hz.
* **VR Lab (Green):** The NMSE starts at approximately -5 dB at 30 Hz, decreases to about -6 dB at 35 Hz, then increases to approximately -3 dB at 60 Hz. It then plateaus around -2 dB to 0 dB from 70 Hz to 300 Hz.
* **Listening Room (Black):** The NMSE starts at approximately -2 dB at 30 Hz, decreases slightly to about -3 dB at 40 Hz, then increases to approximately -1 dB at 60 Hz. It then plateaus around -1 dB to 0 dB from 70 Hz to 300 Hz.
* **Production Room (Red):** The NMSE starts at approximately -4 dB at 30 Hz, decreases slightly to about -4.5 dB at 40 Hz, then increases to approximately -1 dB at 60 Hz. It then plateaus around -1 dB to 0 dB from 70 Hz to 300 Hz.
### Key Observations
* All rooms show a general trend of increasing NMSE with frequency up to around 70 Hz.
* After 70 Hz, the NMSE for all rooms plateaus and remains relatively constant.
* Room B has the lowest NMSE at lower frequencies (30-60 Hz) but catches up with the other rooms at higher frequencies.
* The Listening Room and Production Room have very similar NMSE values across the entire frequency range.
### Interpretation
The chart suggests that the acoustic performance, as measured by NMSE, improves with increasing frequency for all rooms, up to a certain point (around 70 Hz). After this point, the NMSE stabilizes, indicating that the rooms' acoustic characteristics become more consistent across higher frequencies. Room B exhibits a poorer performance at lower frequencies compared to the other rooms, potentially indicating issues with low-frequency response or noise. The similarity between the Listening Room and Production Room suggests they have similar acoustic properties, possibly due to similar design or treatment. The data could be used to identify frequency ranges where specific rooms require acoustic treatment or modifications to improve their performance.