## Line Chart: NMSE (dB) vs Frequency
### Overview
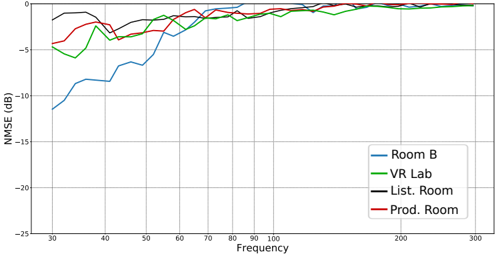
The image is a line chart comparing the Normalized Mean Square Error (NMSE) in decibels (dB) across a frequency range of 30 Hz to 300 Hz. Four data series are plotted, each representing a different environment or condition: Room B (blue), VR Lab (green), List. Room (black), and Prod. Room (red). The chart shows how NMSE varies with frequency for each series.
### Components/Axes
- **X-axis (Frequency)**: Labeled "Frequency" with markers at 30, 40, 50, 60, 70, 80, 90, 100, 200, and 300 Hz. The scale is linear.
- **Y-axis (NMSE (dB))**: Labeled "NMSE (dB)" with markers at -25, -20, -15, -10, -5, and 0 dB. The scale is linear.
- **Legend**: Located in the bottom-right corner, with four entries:
- **Blue**: Room B
- **Green**: VR Lab
- **Black**: List. Room
- **Red**: Prod. Room
### Detailed Analysis
1. **Room B (Blue Line)**:
- Starts at approximately **-15 dB** at 30 Hz.
- Rises sharply to **-5 dB** around 50 Hz.
- Stabilizes near **-5 dB** from 60 Hz to 300 Hz.
- **Key Trend**: Significant initial increase, then plateau.
2. **VR Lab (Green Line)**:
- Begins at **-5 dB** at 30 Hz.
- Dips to **-10 dB** around 40 Hz.
- Rises to **-5 dB** by 60 Hz.
- Fluctuates slightly but remains near **-5 dB** from 70 Hz to 300 Hz.
- **Key Trend**: Initial dip followed by stabilization.
3. **List. Room (Black Line)**:
- Starts at **-5 dB** at 30 Hz.
- Fluctuates between **-5 dB and 0 dB** across the frequency range.
- Peaks near **0 dB** around 100 Hz.
- **Key Trend**: Moderate variability with a peak at mid-frequencies.
4. **Prod. Room (Red Line)**:
- Begins at **-5 dB** at 30 Hz.
- Rises sharply to **0 dB** around 60 Hz.
- Stabilizes near **0 dB** from 70 Hz to 300 Hz.
- **Key Trend**: Sharp increase at mid-frequencies, then plateau.
### Key Observations
- **Room B** exhibits the most pronounced initial increase in NMSE, suggesting higher error at lower frequencies.
- **VR Lab** shows a notable dip at 40 Hz, indicating a potential anomaly or improved performance at that frequency.
- **List. Room** has the least variability, maintaining a relatively stable NMSE between -5 dB and 0 dB.
- **Prod. Room** demonstrates a sharp rise in NMSE at 60 Hz, which could indicate a critical issue or calibration problem at that frequency.
### Interpretation
The data suggests that **Room B** and **Prod. Room** experience significant NMSE increases at specific frequencies, potentially pointing to environmental or measurement inconsistencies. **VR Lab** and **List. Room** show more stable performance, with **VR Lab** having a unique dip at 40 Hz that may require further investigation. The sharp rise in **Prod. Room** at 60 Hz could indicate a critical failure or calibration error, warranting immediate attention. The chart highlights the importance of frequency-specific analysis in evaluating NMSE performance across different environments.