# Technical Data Extraction: Radar Chart Performance Comparison
## 1. Image Overview
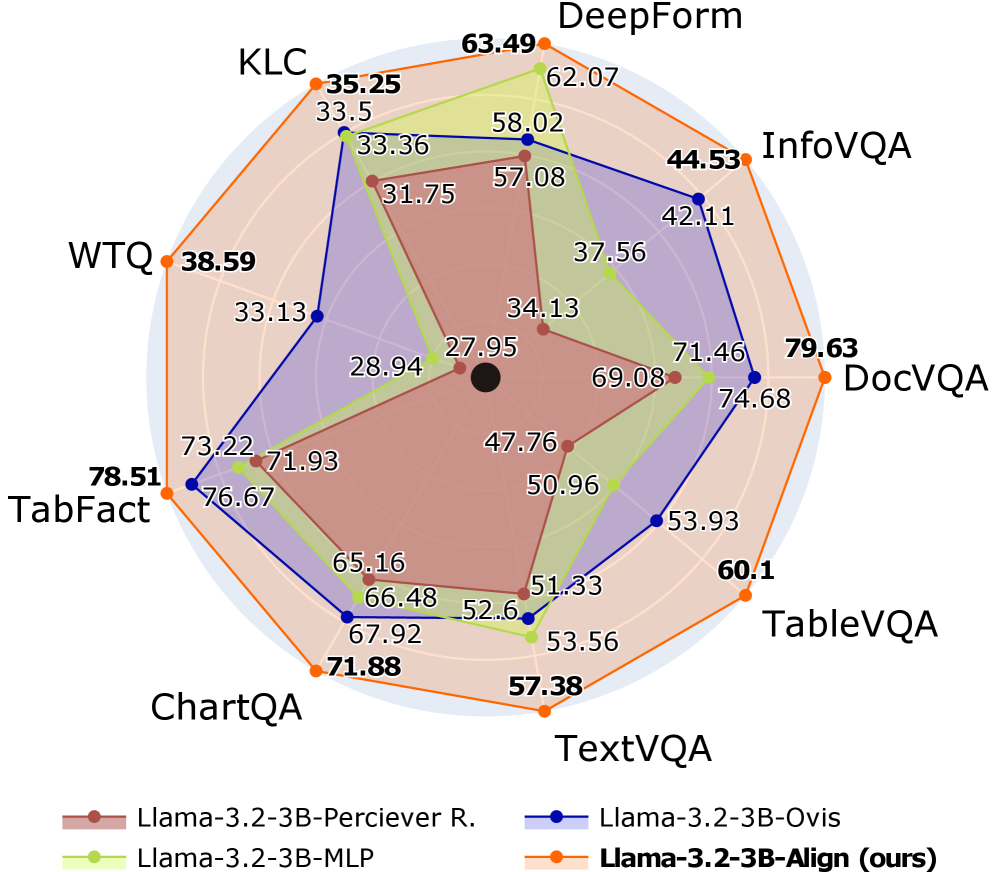
This image is a radar chart (spider chart) comparing the performance of four different AI model configurations across nine distinct benchmarks. The chart uses a circular grid with nine axes radiating from a central point. Each model is represented by a colored line and shaded area.
## 2. Component Isolation
### Header/Labels (Benchmarks)
The chart evaluates models across nine benchmarks, arranged clockwise starting from the top:
1. **DeepForm**
2. **InfoVQA**
3. **DocVQA**
4. **TableVQA**
5. **TextVQA**
6. **ChartQA**
7. **TabFact**
8. **WTQ**
9. **KLC**
### Legend (Footer)
The legend is located at the bottom of the image.
* **Brown (Circle marker):** `Llama-3.2-3B-Perciever R.`
* **Light Green (Circle marker):** `Llama-3.2-3B-MLP`
* **Dark Blue (Circle marker):** `Llama-3.2-3B-Ovis`
* **Orange (Circle marker):** `Llama-3.2-3B-Align (ours)` (Bolded in legend)
---
## 3. Data Table Reconstruction
The following table extracts the numerical values associated with each data point on the radar chart.
| Benchmark | Llama-3.2-3B-Perciever R. (Brown) | Llama-3.2-3B-MLP (Light Green) | Llama-3.2-3B-Ovis (Dark Blue) | Llama-3.2-3B-Align (ours) (Orange) |
| :--- | :---: | :---: | :---: | :---: |
| **DeepForm** | 57.08 | 62.07 | 58.02 | **63.49** |
| **InfoVQA** | 34.13 | 37.56 | 42.11 | **44.53** |
| **DocVQA** | 69.08 | 71.46 | 74.68 | **79.63** |
| **TableVQA** | 51.33 | 53.93 | 53.93 | **60.1** |
| **TextVQA** | 52.6 | 53.56 | 51.33 | **57.38** |
| **ChartQA** | 65.16 | 66.48 | 67.92 | **71.88** |
| **TabFact** | 71.93 | 73.22 | 76.67 | **78.51** |
| **WTQ** | 27.95 | 28.94 | 33.13 | **38.59** |
| **KLC** | 31.75 | 33.36 | 33.5 | **35.25** |
---
## 4. Trend Verification and Analysis
### Llama-3.2-3B-Align (ours) - Orange Line
* **Trend:** This series forms the outermost perimeter of the radar chart. It slopes outward at every single axis compared to the other models.
* **Observation:** This model consistently achieves the highest score across all nine benchmarks. It shows significant leads in **DocVQA (79.63)** and **WTQ (38.59)**.
### Llama-3.2-3B-Ovis - Dark Blue Line
* **Trend:** Generally the second-best performer. It follows the shape of the orange line but sits slightly inward.
* **Observation:** It performs particularly well on **TabFact (76.67)** and **DocVQA (74.68)**, but falls behind the MLP version on **TextVQA (51.33)**.
### Llama-3.2-3B-MLP - Light Green Line
* **Trend:** This series fluctuates between the 2nd and 3rd position.
* **Observation:** It outperforms the Ovis model on **TextVQA (53.56)** and **DeepForm (62.07)**, but generally lags behind Ovis on VQA-specific tasks like **InfoVQA** and **DocVQA**.
### Llama-3.2-3B-Perciever R. - Brown Line
* **Trend:** This series forms the innermost shape, indicating it is the baseline or lowest-performing model in this set.
* **Observation:** It has the lowest scores across all categories, with its lowest relative performance seen in **WTQ (27.95)** and **InfoVQA (34.13)**.
---
## 5. Summary of Findings
The chart demonstrates that the **Llama-3.2-3B-Align (ours)** model provides a comprehensive performance improvement over the other three configurations. The performance gap is most pronounced in document and table understanding tasks (**DocVQA, TableVQA, WTQ**). All models follow a similar performance profile (e.g., all models score relatively lower on WTQ and KLC compared to TabFact or DocVQA), suggesting these benchmarks are inherently more challenging for this model family.