\n
## Radar Chart: Model Performance Comparison
### Overview
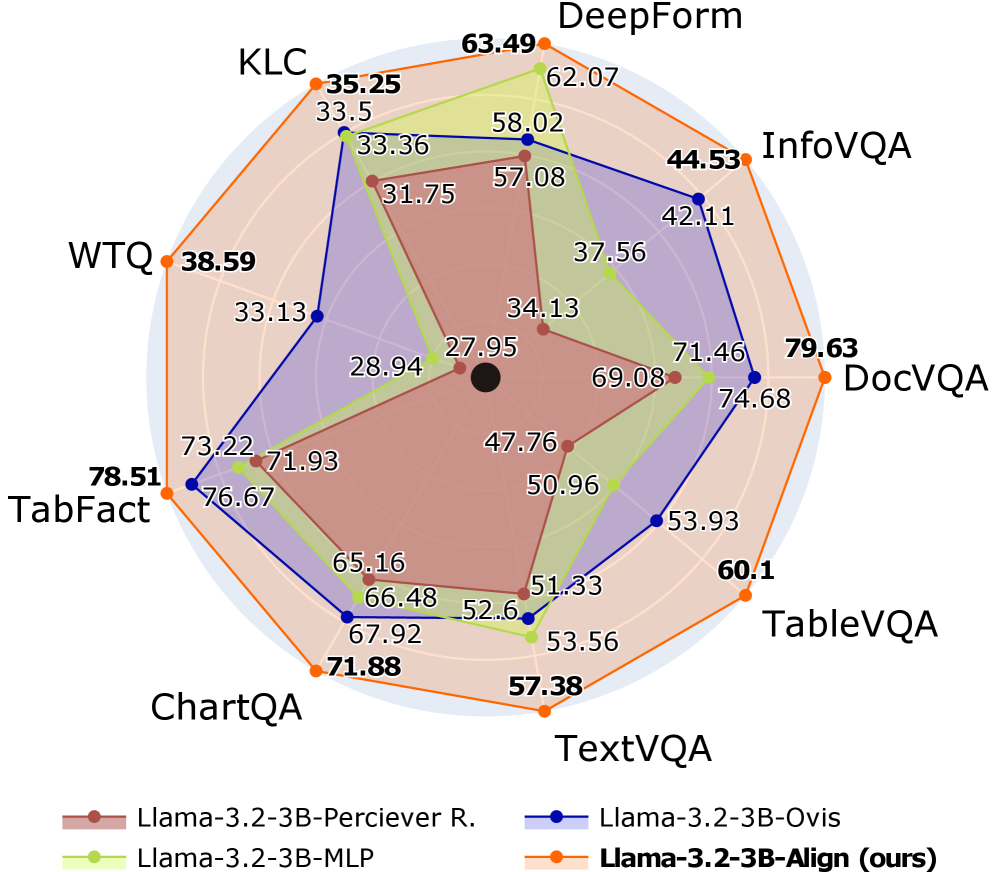
This image presents a radar chart comparing the performance of four different language models – Llama-3.2-3B-Perciever R., Llama-3.2-3B-MLP, Llama-3.2-3B-Ovis, and Llama-3.2-3B-Align (labeled as "ours") – across eight different visual question answering (VQA) datasets: KLC, DeepForm, InfoVQA, DocVQA, TableVQA, TextVQA, ChartQA, and TabFact. The performance is represented by scores, with higher scores indicating better performance.
### Components/Axes
* **Axes/Categories:** KLC, DeepForm, InfoVQA, DocVQA, TableVQA, TextVQA, ChartQA, TabFact. These are arranged radially around the chart.
* **Radial Scale:** The chart uses a radial scale, with values increasing outwards from the center. The scale is not explicitly labeled with numerical values, but the data points indicate a range from approximately 27 to 80.
* **Legend:** Located at the bottom center of the image, the legend identifies each model with a corresponding color:
* Llama-3.2-3B-Perciever R. (Green)
* Llama-3.2-3B-MLP (Light Green)
* Llama-3.2-3B-Ovis (Blue)
* Llama-3.2-3B-Align (ours) (Orange)
### Detailed Analysis
The chart displays performance scores for each model on each dataset, connected by lines forming a polygon for each model.
* **Llama-3.2-3B-Perciever R. (Green):**
* KLC: ~33.5
* DeepForm: ~62.07
* InfoVQA: ~42.11
* DocVQA: ~71.46
* TableVQA: ~53.93
* TextVQA: ~51.33
* ChartQA: ~66.48
* TabFact: ~73.22
* Trend: Generally consistent performance across datasets, with peaks at DeepForm and DocVQA.
* **Llama-3.2-3B-MLP (Light Green):**
* KLC: ~31.75
* DeepForm: ~58.02
* InfoVQA: ~37.56
* DocVQA: ~69.08
* TableVQA: ~50.96
* TextVQA: ~52.6
* ChartQA: ~65.16
* TabFact: ~76.67
* Trend: Similar to Perceiver R., but generally lower scores.
* **Llama-3.2-3B-Ovis (Blue):**
* KLC: ~28.94
* DeepForm: ~57.08
* InfoVQA: ~34.13
* DocVQA: ~74.68
* TableVQA: ~47.76
* TextVQA: ~53.56
* ChartQA: ~67.92
* TabFact: ~71.93
* Trend: Lowest performance overall, with a relatively flat profile.
* **Llama-3.2-3B-Align (ours) (Orange):**
* KLC: ~35.25
* DeepForm: ~63.49
* InfoVQA: ~44.53
* DocVQA: ~79.63
* TableVQA: ~60.1
* TextVQA: ~57.38
* ChartQA: ~71.88
* TabFact: ~78.51
* Trend: Highest performance overall, with peaks at DocVQA and TabFact.
### Key Observations
* **"Ours" (Llama-3.2-3B-Align) consistently outperforms the other models** across all datasets, particularly in DocVQA and TabFact.
* **DeepForm and DocVQA generally show the highest scores** across all models, suggesting these datasets are easier to solve.
* **InfoVQA and TableVQA consistently show the lowest scores**, indicating these datasets are more challenging.
* **Perceiver R. and MLP show similar performance profiles**, with Perceiver R. generally slightly outperforming MLP.
### Interpretation
The radar chart demonstrates that the Llama-3.2-3B-Align model ("ours") achieves superior performance compared to the other three models across a diverse set of VQA datasets. This suggests that the alignment strategy employed in this model is effective in improving its ability to reason about and answer questions related to visual information. The consistent outperformance across different dataset types (KLC, DeepForm, InfoVQA, DocVQA, TableVQA, TextVQA, ChartQA, TabFact) indicates a robust improvement in the model's overall VQA capabilities. The relative difficulty of the datasets, as indicated by the score ranges, provides insights into the challenges inherent in different VQA tasks. The higher scores on DeepForm and DocVQA might be attributed to the simpler visual reasoning required, while the lower scores on InfoVQA and TableVQA suggest the need for more complex reasoning and understanding of visual elements and their relationships. The chart effectively visualizes the trade-offs between different models and datasets, providing a clear comparison of their strengths and weaknesses.