## Radar Chart: Model Performance Comparison Across Visual Question Answering and Document Understanding Benchmarks
### Overview
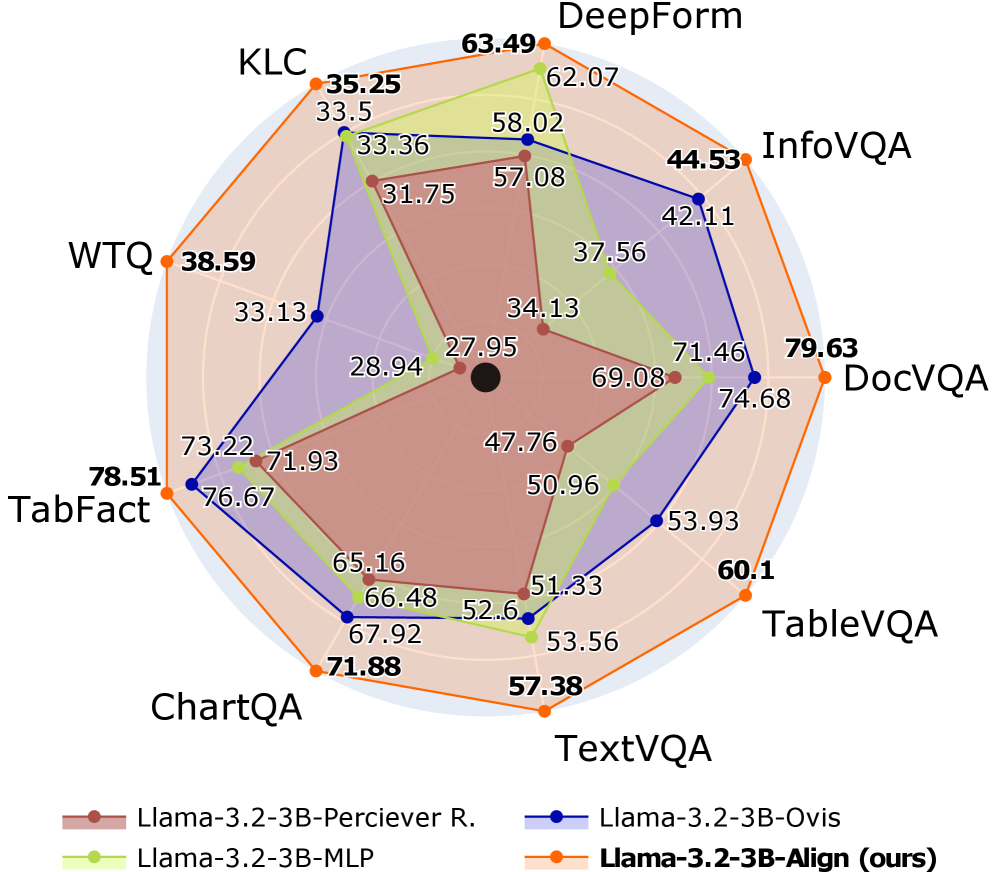
The image is a radar chart (spider plot) comparing the performance of four different AI models across nine distinct benchmarks. The chart uses a multi-axis layout where each axis represents a specific benchmark, and the distance from the center indicates the performance score (higher is better). The four models are represented by colored lines with filled areas underneath, creating overlapping polygons.
### Components/Axes
* **Chart Type:** Radar Chart / Spider Plot
* **Axes (Benchmarks):** Nine axes radiate from the center, each labeled with a benchmark name. Clockwise from the top:
1. **DeepForm**
2. **InfoVQA**
3. **DocVQA**
4. **TableVQA**
5. **TextVQA**
6. **ChartQA**
7. **TabFact**
8. **WTQ**
9. **KLC**
* **Legend (Bottom Center):** A legend identifies the four data series:
* **Brown Line with Circle Markers:** `Llama-3.2-3B-Perciever R.`
* **Green Line with Circle Markers:** `Llama-3.2-3B-MLP`
* **Blue Line with Circle Markers:** `Llama-3.2-3B-Ovis`
* **Orange Line with Circle Markers:** `Llama-3.2-3B-Align (ours)`
* **Data Points:** Each axis has numerical values plotted for each model, connected by lines. The values are explicitly labeled on the chart near their respective data points.
### Detailed Analysis
The following table reconstructs the performance scores for each model on each benchmark. Values are transcribed directly from the chart labels.
| Benchmark | Llama-3.2-3B-Perciever R. (Brown) | Llama-3.2-3B-MLP (Green) | Llama-3.2-3B-Ovis (Blue) | Llama-3.2-3B-Align (ours) (Orange) |
| :--- | :--- | :--- | :--- | :--- |
| **DeepForm** | 57.08 | 62.07 | 58.02 | **63.49** |
| **InfoVQA** | 34.13 | 37.56 | 42.11 | **44.53** |
| **DocVQA** | 47.76 | 69.08 | 74.68 | **79.63** |
| **TableVQA** | 50.96 | 53.56 | 53.93 | **60.1** |
| **TextVQA** | 51.33 | 52.6 | 53.93 | **57.38** |
| **ChartQA** | 65.16 | 66.48 | 67.92 | **71.88** |
| **TabFact** | 71.93 | 73.22 | 76.67 | **78.51** |
| **WTQ** | 28.94 | 33.13 | 33.13 | **38.59** |
| **KLC** | 31.75 | 33.36 | 33.5 | **35.25** |
**Visual Trend Verification:**
* **Llama-3.2-3B-Align (Orange):** Forms the outermost polygon on the chart. Its line consistently encloses the lines of the other three models across all axes, indicating superior performance on every benchmark.
* **Llama-3.2-3B-Ovis (Blue):** Generally forms the second-outermost layer, closely following the orange line but consistently inside it.
* **Llama-3.2-3B-MLP (Green):** Typically resides inside the blue polygon, showing lower performance than Ovis but higher than Perciever R. on most tasks.
* **Llama-3.2-3B-Perciever R. (Brown):** Forms the innermost polygon, indicating the lowest performance among the four models across all benchmarks.
### Key Observations
1. **Consistent Hierarchy:** There is a clear and consistent performance hierarchy across all nine benchmarks: `Align (ours)` > `Ovis` > `MLP` > `Perciever R.`. No benchmark shows a reversal of this order.
2. **Performance Spread:** The performance gap between the best (`Align`) and worst (`Perciever R.`) model varies significantly by task.
* **Largest Gaps:** DocVQA (79.63 vs. 47.76, a 31.87-point difference) and InfoVQA (44.53 vs. 34.13, a 10.4-point difference).
* **Smallest Gaps:** KLC (35.25 vs. 31.75, a 3.5-point difference) and TextVQA (57.38 vs. 51.33, a 6.05-point difference).
3. **Benchmark Difficulty:** The absolute scores suggest varying difficulty across benchmarks for these models.
* **Highest Scores:** Models achieve their highest scores on **TabFact** (all models >71) and **DocVQA** (top model nearly 80).
* **Lowest Scores:** Models struggle most with **WTQ** (all models <39) and **KLC** (all models <36).
4. **Model Strengths:** While `Align` leads everywhere, its most dominant performances are in document and visual understanding tasks like **DocVQA** and **InfoVQA**.
### Interpretation
This radar chart serves as a comprehensive benchmark evaluation, likely from a research paper introducing the `Llama-3.2-3B-Align` model. The data demonstrates that the proposed `Align` method provides a consistent and significant improvement over three baseline variants (`Perciever R.`, `MLP`, `Ovis`) of the same underlying 3B-parameter Llama model architecture across a diverse suite of tasks involving visual question answering, document understanding, table parsing, and chart interpretation.
The consistent hierarchy suggests that the modifications in the `Align` variant are fundamentally more effective for multimodal reasoning than the architectural choices in the other variants. The particularly large gains on **DocVQA** and **InfoVQA** indicate that the `Align` approach may be especially adept at extracting and reasoning about information from complex, text-rich documents and images. Conversely, the smaller gaps on **KLC** and **TextVQA** might suggest these tasks rely on capabilities where the architectural differences have less impact, or they represent a closer performance ceiling for this model scale.
The chart effectively argues for the superiority of the `Align` method by showing it is not just better on average, but universally better across every single measured dimension of performance.