# Technical Document Extraction: Radar Chart Analysis
## 1. **Legend & Color Mapping**
- **Legend Position**: Bottom of the chart.
- **Color-Model Mapping**:
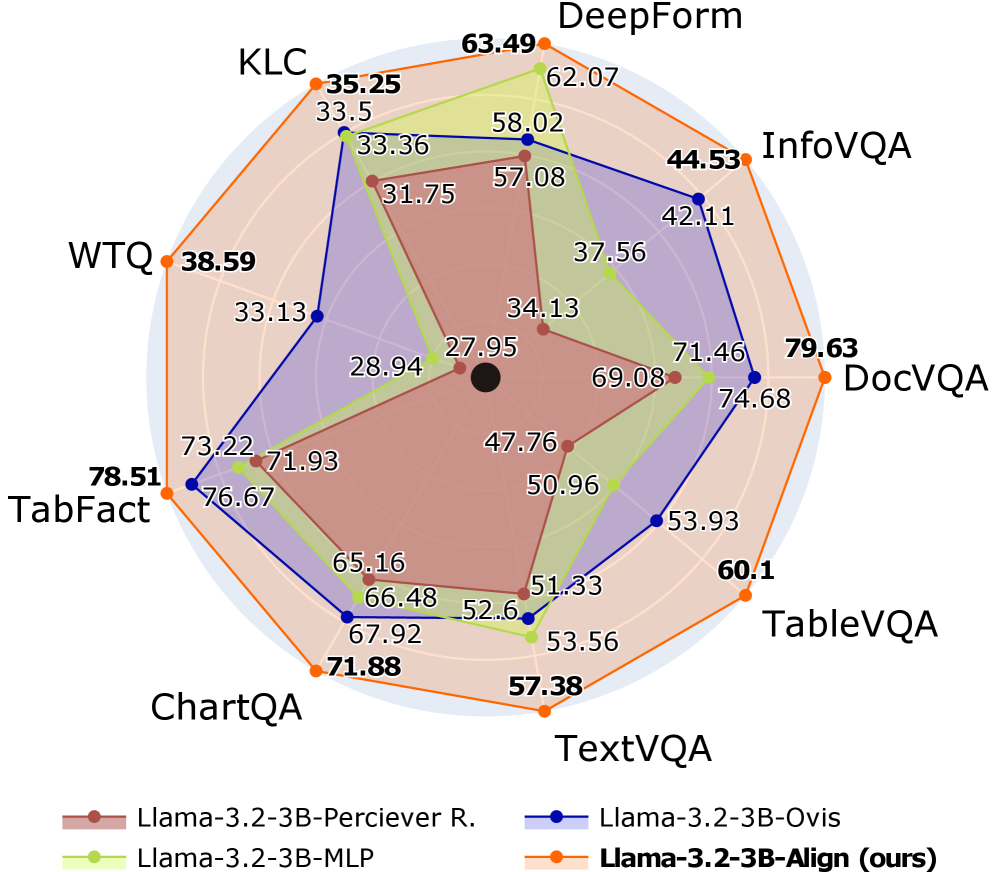
- **Red**: Llama-3.2-3B-Perciever R.
- **Blue**: Llama-3.2-3B-Ovis
- **Green**: Llama-3.2-3B-MLP
- **Orange**: Llama-3.2-3B-Align (ours)
## 2. **Benchmarks (Axis Labels)**
The benchmarks are arranged clockwise around the radar chart:
1. **KLC**
2. **WTQ**
3. **TabFact**
4. **ChartQA**
5. **TextVQA**
6. **TableVQA**
7. **DocVQA**
8. **InfoVQA**
9. **DeepForm**
## 3. **Data Points & Values**
Each benchmark has four data points corresponding to the four models. Values are extracted as follows:
### **KLC**
- Llama-3.2-3B-Perciever R.: 31.75
- Llama-3.2-3B-Ovis: 33.5
- Llama-3.2-3B-MLP: 62.07
- Llama-3.2-3B-Align: 63.49
### **WTQ**
- Llama-3.2-3B-Perciever R.: 28.94
- Llama-3.2-3B-Ovis: 33.13
- Llama-3.2-3B-MLP: 57.08
- Llama-3.2-3B-Align: 38.59
### **TabFact**
- Llama-3.2-3B-Perciever R.: 47.76
- Llama-3.2-3B-Ovis: 73.22
- Llama-3.2-3B-MLP: 71.93
- Llama-3.2-3B-Align: 78.51
### **ChartQA**
- Llama-3.2-3B-Perciever R.: 51.33
- Llama-3.2-3B-Ovis: 66.48
- Llama-3.2-3B-MLP: 65.16
- Llama-3.2-3B-Align: 71.88
### **TextVQA**
- Llama-3.2-3B-Perciever R.: 57.38
- Llama-3.2-3B-Ovis: 52.6
- Llama-3.2-3B-MLP: 53.56
- Llama-3.2-3B-Align: 60.1
### **TableVQA**
- Llama-3.2-3B-Perciever R.: 69.08
- Llama-3.2-3B-Ovis: 74.68
- Llama-3.2-3B-MLP: 71.46
- Llama-3.2-3B-Align: 79.63
### **DocVQA**
- Llama-3.2-3B-Perciever R.: 50.96
- Llama-3.2-3B-Ovis: 71.46
- Llama-3.2-3B-MLP: 53.93
- Llama-3.2-3B-Align: 79.63
### **InfoVQA**
- Llama-3.2-3B-Perciever R.: 34.13
- Llama-3.2-3B-Ovis: 42.11
- Llama-3.2-3B-MLP: 37.56
- Llama-3.2-3B-Align: 44.53
### **DeepForm**
- Llama-3.2-3B-Perciever R.: 27.95
- Llama-3.2-3B-Ovis: 58.02
- Llama-3.2-3B-MLP: 62.07
- Llama-3.2-3B-Align: 63.49
## 4. **Trend Verification**
- **Llama-3.2-3B-Align (Orange)**: Consistently high performance across most benchmarks (e.g., **DocVQA: 79.63**, **TabFact: 78.51**).
- **Llama-3.2-3B-Ovis (Blue)**: Strong in **TabFact (73.22)** and **InfoVQA (42.11)**, but weaker in **KLC (33.5)** and **WTQ (33.13)**.
- **Llama-3.2-3B-MLP (Green)**: Peaks in **KLC (62.07)** and **TabFact (71.93)**, but lags in **WTQ (57.08)** and **InfoVQA (37.56)**.
- **Llama-3.2-3B-Perciever R. (Red)**: Lowest performance overall (e.g., **KLC: 31.75**, **DeepForm: 27.95**).
## 5. **Spatial Grounding**
- **Legend**: Located at the bottom of the chart.
- **Data Point Colors**: Match the legend exactly (e.g., orange for Align, blue for Ovis).
## 6. **Component Isolation**
- **Header**: Not explicitly labeled; benchmarks are axis labels.
- **Main Chart**: Radar chart with four overlapping polygons (one per model).
- **Footer**: Legend with model names and colors.
## 7. **Additional Notes**
- No non-English text detected.
- All axis labels and data points are in English.
- The chart compares model performance across 9 benchmarks, with **Llama-3.2-3B-Align** generally outperforming others.
## 8. **Data Table Reconstruction**
| Benchmark | Llama-3.2-3B-Perciever R. | Llama-3.2-3B-Ovis | Llama-3.2-3B-MLP | Llama-3.2-3B-Align |
|-------------|---------------------------|-------------------|------------------|--------------------|
| KLC | 31.75 | 33.5 | 62.07 | 63.49 |
| WTQ | 28.94 | 33.13 | 57.08 | 38.59 |
| TabFact | 47.76 | 73.22 | 71.93 | 78.51 |
| ChartQA | 51.33 | 66.48 | 65.16 | 71.88 |
| TextVQA | 57.38 | 52.6 | 53.56 | 60.1 |
| TableVQA | 69.08 | 74.68 | 71.46 | 79.63 |
| DocVQA | 50.96 | 71.46 | 53.93 | 79.63 |
| InfoVQA | 34.13 | 42.11 | 37.56 | 44.53 |
| DeepForm | 27.95 | 58.02 | 62.07 | 63.49 |
## 9. **Conclusion**
The radar chart demonstrates that **Llama-3.2-3B-Align (ours)** achieves the highest scores across most benchmarks, particularly in **DocVQA (79.63)** and **TabFact (78.51)**. Other models show variability, with **Llama-3.2-3B-Ovis** excelling in **TabFact (73.22)** and **Llama-3.2-3B-MLP** performing well in **KLC (62.07)**. The **Perciever R.** model consistently underperforms.