## Line Chart: Proportion of Bitwise Reproducible Packages Over Time
### Overview
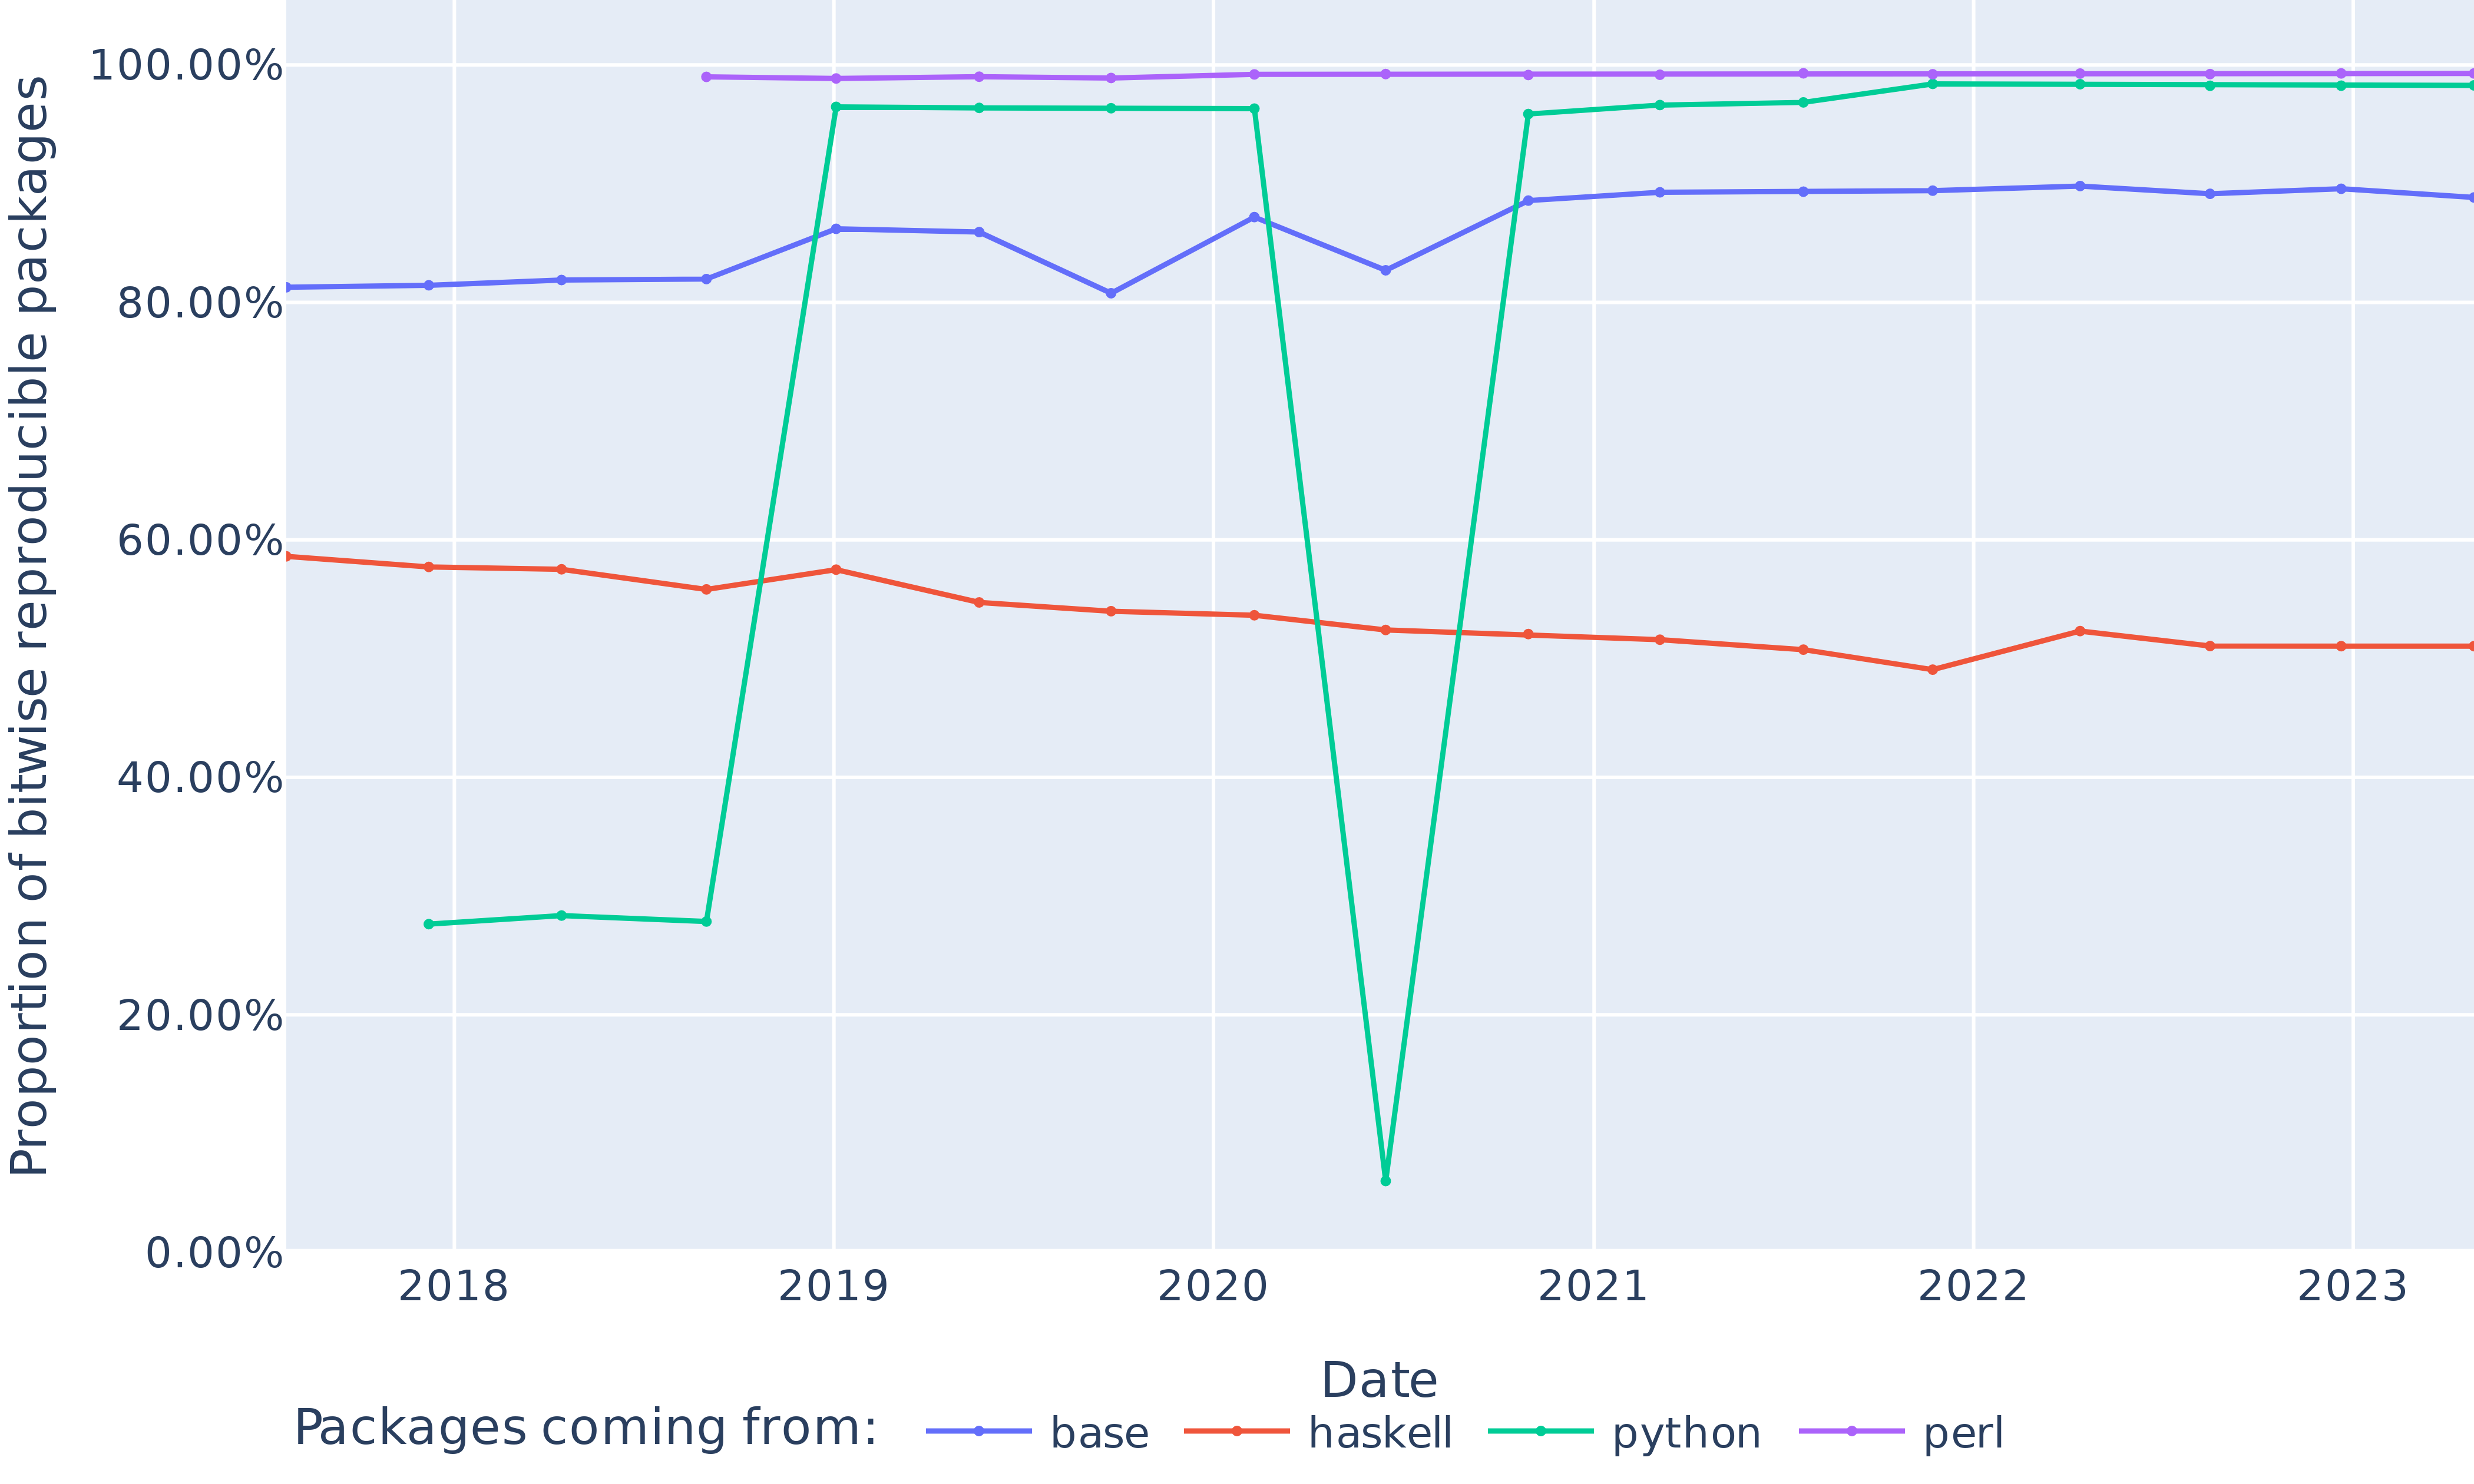
The image is a line chart showing the proportion of bitwise reproducible packages over time for four different package sources: base, haskell, python, and perl. The x-axis represents the date, ranging from 2018 to 2023. The y-axis represents the proportion of bitwise reproducible packages, ranging from 0.00% to 100.00%. Each package source is represented by a different colored line.
### Components/Axes
* **Title (Y-Axis):** "Proportion of bitwise reproducible packages"
* Scale: 0.00% to 100.00% in increments of 20.00%
* **Title (X-Axis):** "Date"
* Scale: 2018, 2019, 2020, 2021, 2022, 2023
* **Legend:** Located at the bottom of the chart.
* "Packages coming from:"
* Blue line: "base"
* Red line: "haskell"
* Green line: "python"
* Purple line: "perl"
### Detailed Analysis
* **Base (Blue):** The proportion of reproducible packages from "base" starts at approximately 81% in 2018, increases slightly to about 82% in 2019, then increases to approximately 87% in 2019. It decreases to approximately 81% in 2020, increases to approximately 89% in 2021, and remains relatively stable around 90% from 2021 to 2023.
* 2018: ~81%
* 2019: ~82%
* 2020: ~81%
* 2021: ~89%
* 2022: ~90%
* 2023: ~89%
* **Haskell (Red):** The proportion of reproducible packages from "haskell" starts at approximately 59% in 2018, decreases slightly to about 56% in 2019, then increases to approximately 57% in 2019. It decreases to approximately 54% in 2020, decreases to approximately 53% in 2021, and decreases to approximately 50% in 2022, then increases to approximately 52% in 2023.
* 2018: ~59%
* 2019: ~56%
* 2020: ~54%
* 2021: ~53%
* 2022: ~50%
* 2023: ~52%
* **Python (Green):** The proportion of reproducible packages from "python" starts at approximately 28% in 2018, increases sharply to about 96% in 2019, remains stable at approximately 96% in 2020, then drops sharply to about 7% in 2021, then increases sharply to about 95% in 2021, and increases slightly to approximately 98% in 2023.
* 2018: ~28%
* 2019: ~96%
* 2020: ~96%
* 2021: ~7%
* 2022: ~97%
* 2023: ~98%
* **Perl (Purple):** The proportion of reproducible packages from "perl" is consistently high, starting at approximately 99% in 2018 and remaining relatively stable around 99% to 100% throughout the entire period.
* 2018: ~99%
* 2019: ~99%
* 2020: ~99%
* 2021: ~99%
* 2022: ~99%
* 2023: ~99%
### Key Observations
* Perl consistently has the highest proportion of reproducible packages.
* Python experiences a significant drop in reproducibility in 2021, followed by a recovery.
* Haskell has the lowest proportion of reproducible packages and shows a slight downward trend.
* Base shows a gradual increase in reproducibility over the period.
### Interpretation
The chart illustrates the varying levels of effort and success in achieving bitwise reproducibility across different package ecosystems. Perl demonstrates a strong commitment to reproducibility, while Haskell lags behind. The dramatic fluctuation in Python's reproducibility suggests a potential issue or change in the build process around 2021. The gradual increase in Base's reproducibility indicates a steady improvement in their build process. These trends highlight the importance of consistent and well-maintained build processes for ensuring software reproducibility.