\n
## Line Chart: Proportion of Bitwise Reproducible Packages Over Time
### Overview
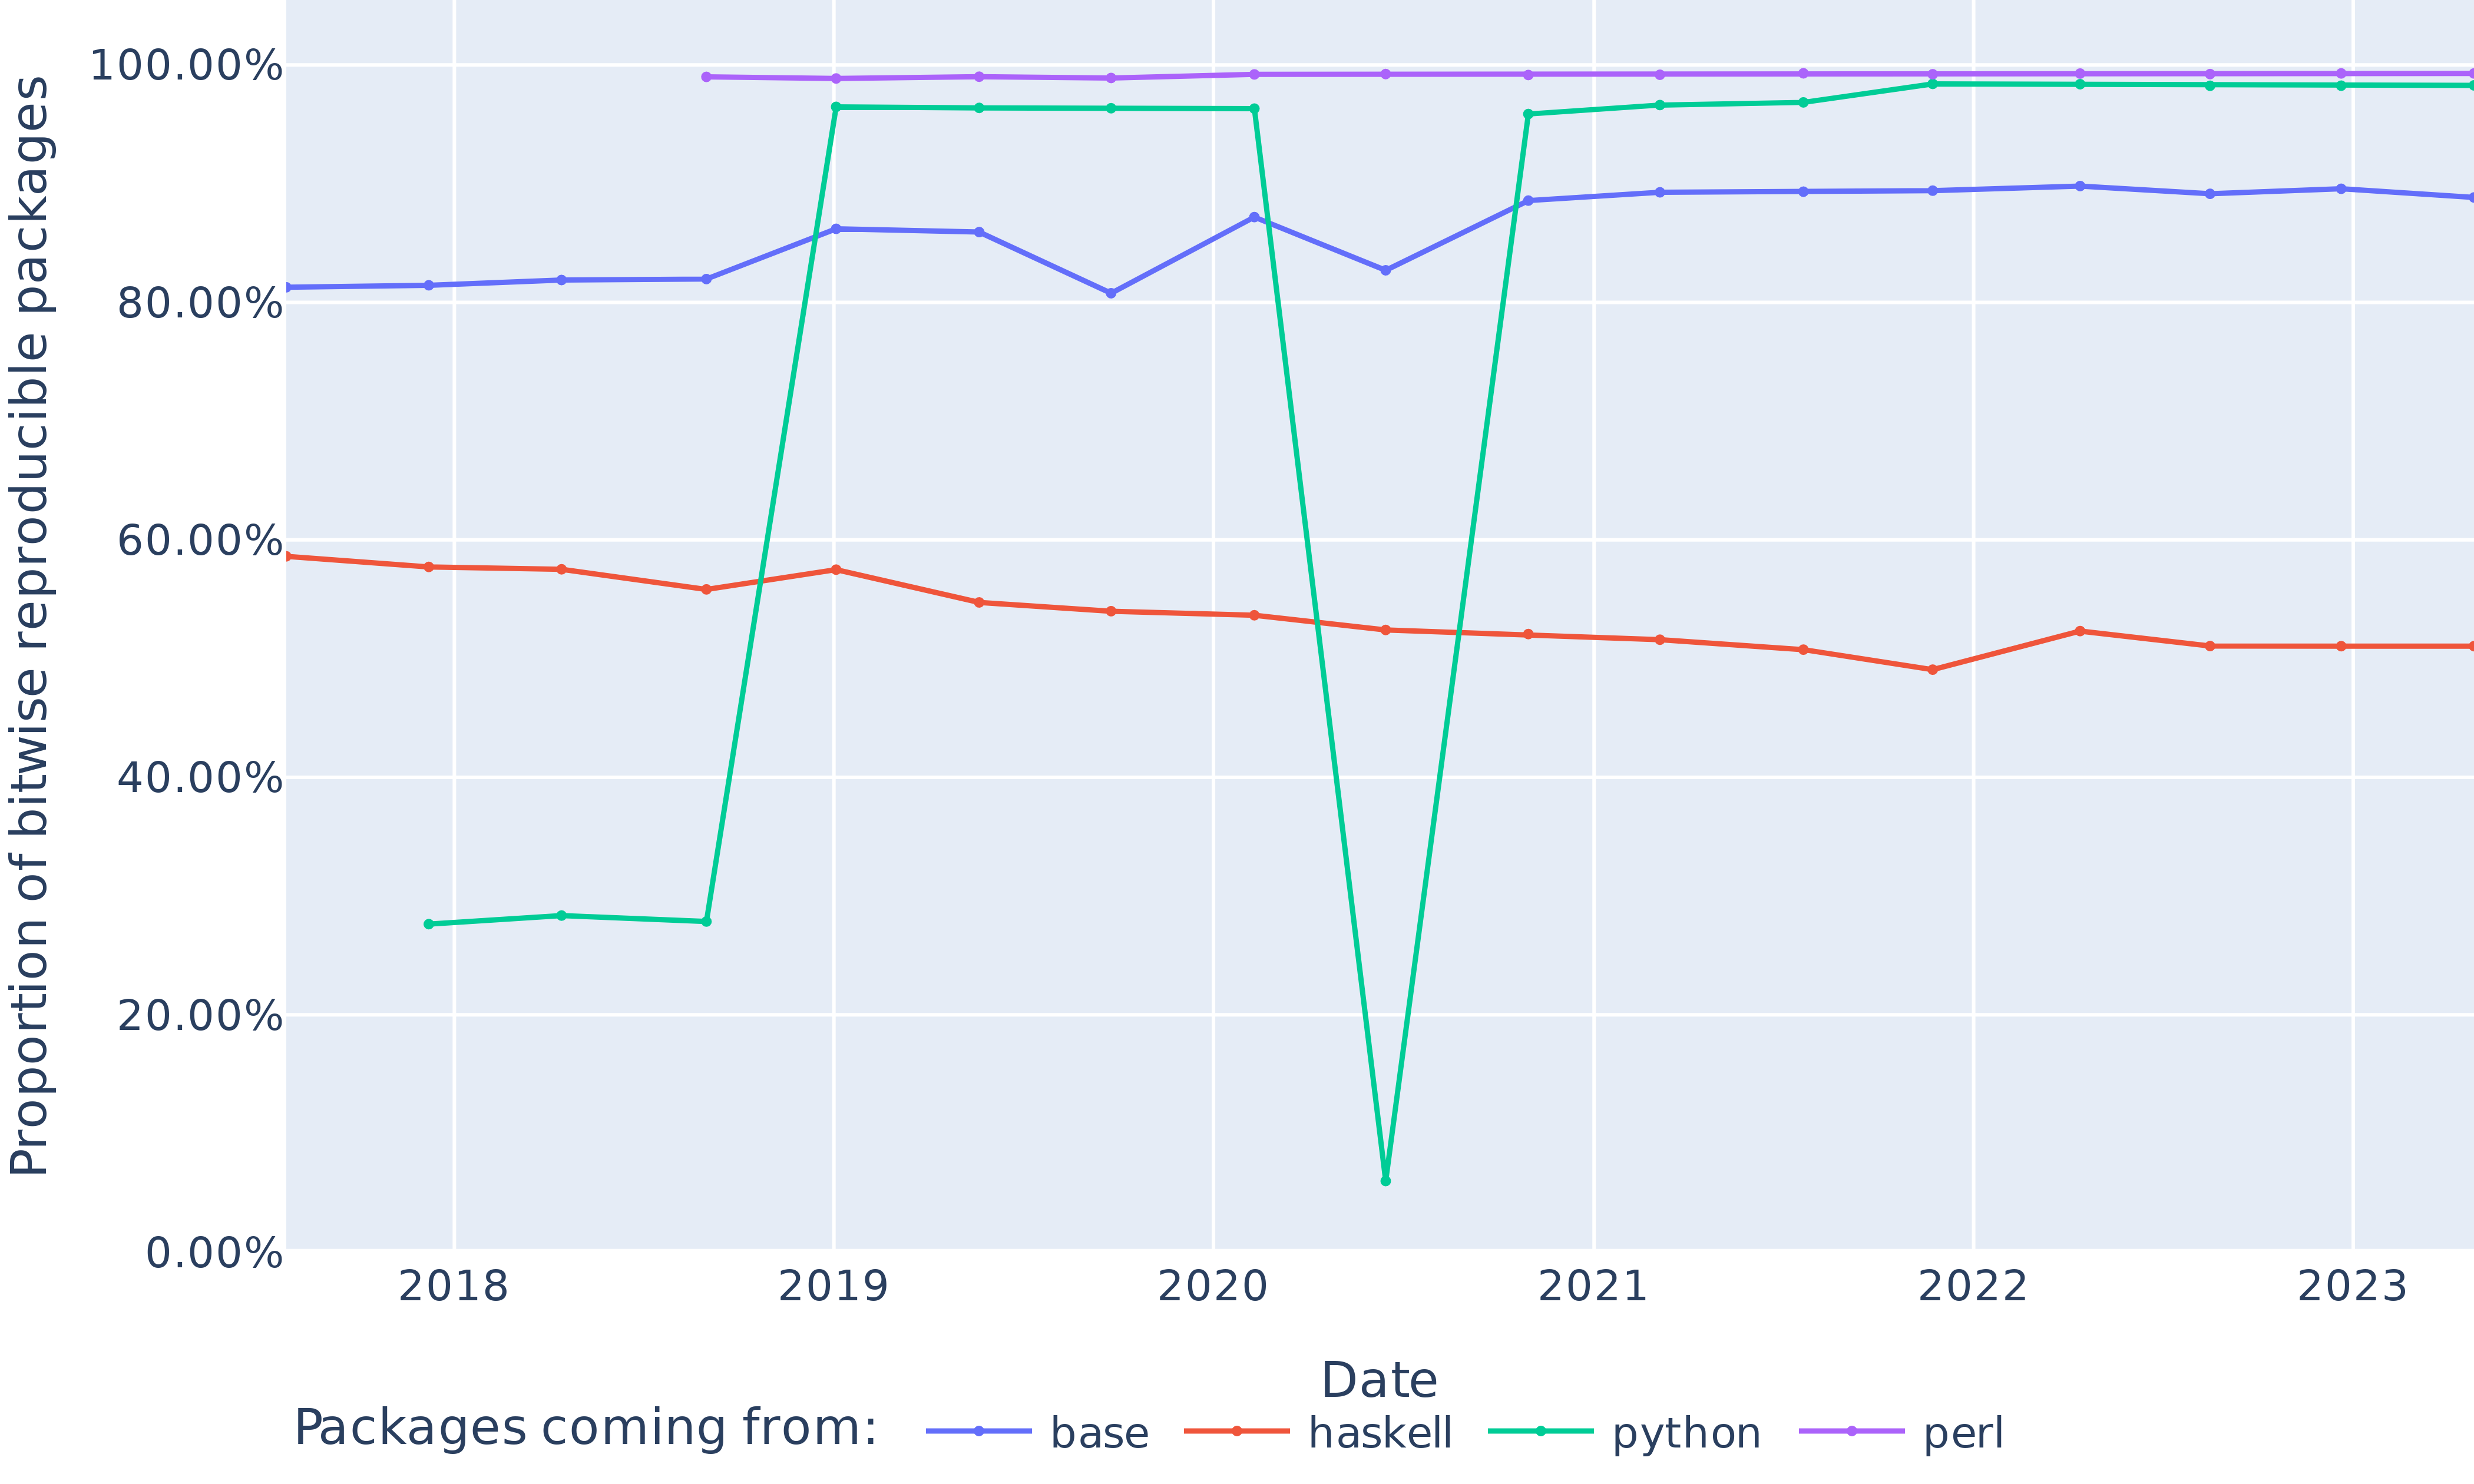
This line chart displays the proportion of bitwise reproducible packages over time, from 2018 to 2023. The chart tracks four different package sources: base, Haskell, Python, and Perl. The y-axis represents the proportion (as a percentage) of bitwise reproducible packages, while the x-axis represents the date.
### Components/Axes
* **X-axis Title:** Date
* **Y-axis Title:** Proportion of bitwise reproducible packages
* **Y-axis Scale:** 0.00% to 100.00%
* **X-axis Scale:** 2018 to 2023
* **Legend:** Located at the bottom-center of the chart.
* **base:** Green line
* **haskell:** Blue line
* **python:** Red line
* **perl:** Purple line
### Detailed Analysis
* **base (Green Line):** The line starts at approximately 30% in 2018, rises sharply to nearly 100% around 2019, remains at approximately 100% through 2022, and then dips slightly to approximately 95% in 2023.
* **haskell (Blue Line):** The line begins at approximately 80% in 2018, decreases to around 70% in 2019, rises to approximately 90% in 2020, drops to around 75% in 2021, and then stabilizes around 80% through 2023.
* **python (Red Line):** The line starts at approximately 60% in 2018, fluctuates between 50% and 60% through 2020, then decreases to approximately 45% in 2021, and remains around 50% through 2023.
* **perl (Purple Line):** The line begins at approximately 80% in 2018, decreases to around 65% in 2019, drops sharply to approximately 10% in 2020, rises to approximately 70% in 2021, and then stabilizes around 75% through 2023.
### Key Observations
* The "base" packages demonstrate the highest and most stable reproducibility rate, consistently above 90% after 2019.
* "Perl" packages experienced the most significant fluctuation in reproducibility, with a dramatic drop in 2020 followed by a recovery.
* "Python" packages consistently exhibit the lowest reproducibility rate among the four package sources.
* "Haskell" packages show moderate fluctuations, generally remaining between 70% and 90%.
### Interpretation
The chart illustrates the varying levels of bitwise reproducibility across different package sources over time. The significant improvement in "base" package reproducibility around 2019 suggests successful implementation of reproducibility measures within that ecosystem. The volatility of "Perl" reproducibility indicates potential challenges or changes in the build process or dependencies. The consistently lower reproducibility rate of "Python" packages may point to inherent complexities in the Python packaging ecosystem or a lack of focus on bitwise reproducibility. The data suggests that achieving bitwise reproducibility is not uniform across different programming language ecosystems and requires ongoing effort and attention. The sharp changes in the lines indicate specific events or changes in the build or packaging processes that impacted reproducibility. The overall trend suggests that while reproducibility is improving for some package sources, it remains a challenge for others.