## Heatmap: Attention and MLP Layer Analysis
### Overview
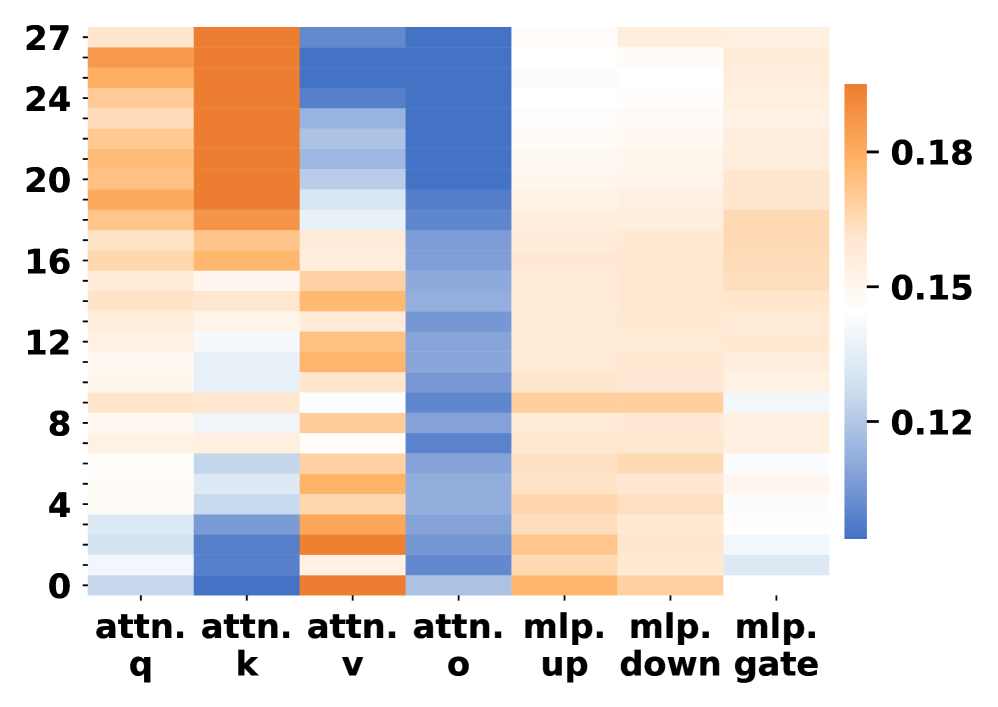
The image is a heatmap visualizing the activity or importance of different components within attention and Multilayer Perceptron (MLP) layers. The heatmap uses a color gradient from blue to orange, representing values from approximately 0.12 to 0.18. The y-axis represents layers, numbered from 0 to 27. The x-axis represents different components: attention query (attn. q), attention key (attn. k), attention value (attn. v), attention output (attn. o), MLP up, MLP down, and MLP gate.
### Components/Axes
* **Y-axis:** Layers, ranging from 0 to 27 in increments of 4, with labels at 0, 4, 8, 12, 16, 20, 24, and 27.
* **X-axis:** Components of attention and MLP layers:
* attn. q (attention query)
* attn. k (attention key)
* attn. v (attention value)
* attn. o (attention output)
* mlp. up (MLP up)
* mlp. down (MLP down)
* mlp. gate (MLP gate)
* **Color Scale (Legend):** Located on the right side of the heatmap.
* Blue: ~0.12
* White: ~0.15
* Orange: ~0.18
### Detailed Analysis
* **attn. q (attention query):** The top layers (20-27) show high activity (orange), decreasing towards the bottom layers (0-8), where activity is low (white/light orange).
* **attn. k (attention key):** Similar to attn. q, the top layers (20-27) show high activity (orange), decreasing towards the bottom layers (0-8), where activity is low (white/light orange).
* **attn. v (attention value):** Shows low activity (blue) across all layers, with some slight increases (lighter blue) in the middle layers (8-16).
* **attn. o (attention output):** Shows low activity (blue) across all layers, with some slight increases (lighter blue) in the middle layers (8-16).
* **mlp. up (MLP up):** Shows moderate activity (light orange) across all layers, with some slight increases (orange) in the middle layers (12-20).
* **mlp. down (MLP down):** Shows moderate activity (light orange) across all layers, with some slight increases (orange) in the middle layers (12-20).
* **mlp. gate (MLP gate):** Shows moderate activity (light orange) across all layers, with some slight increases (orange) in the middle layers (12-20).
### Key Observations
* Attention queries and keys (attn. q and attn. k) are most active in the top layers.
* Attention values and outputs (attn. v and attn. o) show relatively low activity across all layers.
* MLP components (mlp. up, mlp. down, and mlp. gate) show moderate activity across all layers, with some increased activity in the middle layers.
### Interpretation
The heatmap suggests that in the analyzed model, attention queries and keys are more important in the higher layers, while attention values and outputs have a more consistent, lower-level impact. The MLP components show a relatively uniform distribution of activity across layers, with a slight increase in the middle layers, suggesting a consistent role throughout the network with some increased importance in the middle layers. The distinct patterns for attention and MLP components indicate different roles and importance within the model's architecture. The color scale indicates the relative importance or activity level of each component at each layer.