\n
## Heatmap: Attention and MLP Layer Contributions
### Overview
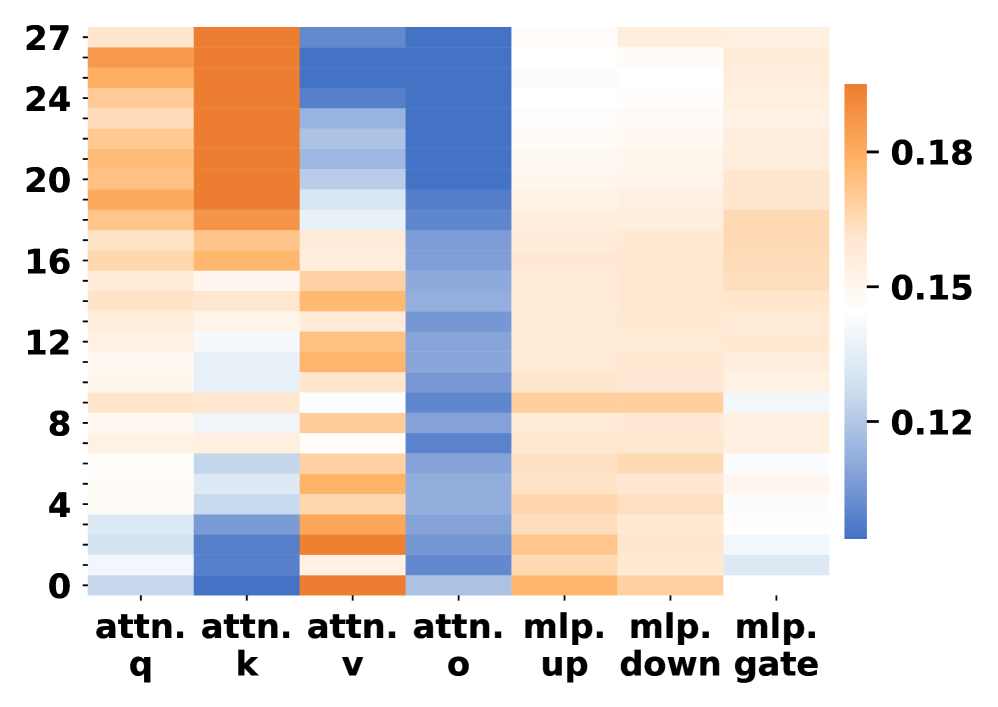
The image presents a heatmap visualizing the contributions of different attention and Multi-Layer Perceptron (MLP) components across various layers. The x-axis represents different components (attn. q, attn. k, attn. v, attn. o, mlp. up, mlp. down, mlp. gate), and the y-axis represents layer numbers ranging from 0 to 27. The color intensity indicates the magnitude of the contribution, with a colorbar on the right showing the scale from 0.12 to 0.18.
### Components/Axes
* **X-axis:** Represents different components:
* `attn. q` (Attention Query)
* `attn. k` (Attention Key)
* `attn. v` (Attention Value)
* `attn. o` (Attention Output)
* `mlp. up` (MLP Up-projection)
* `mlp. down` (MLP Down-projection)
* `mlp. gate` (MLP Gate)
* **Y-axis:** Represents layer numbers, ranging from 0 to 27, with markers at intervals of 4 (0, 4, 8, 12, 16, 20, 24, 27).
* **Colorbar:** Located on the right side of the heatmap, indicating the value scale.
* Minimum Value: 0.12 (represented by light blue)
* Maximum Value: 0.18 (represented by dark orange)
### Detailed Analysis
The heatmap displays varying levels of contribution for each component across different layers.
* **attn. q:** Shows a relatively consistent contribution across layers, generally around 0.14-0.16. There's a slight increase in contribution towards the higher layers (20-27).
* **attn. k:** Exhibits a strong contribution in the initial layers (0-8), peaking around 0.17-0.18. The contribution then decreases significantly in subsequent layers, falling to around 0.12-0.14.
* **attn. v:** Displays a pattern similar to `attn. k`, with high contribution in the initial layers (0-8) and a decline in later layers. The peak contribution is around 0.16-0.17.
* **attn. o:** Shows a gradual increase in contribution from lower layers (0-8) to higher layers (20-27), reaching a peak of approximately 0.17-0.18 in the highest layers.
* **mlp. up:** Exhibits a relatively consistent contribution across layers, generally around 0.14-0.16.
* **mlp. down:** Shows a similar pattern to `mlp. up`, with a consistent contribution around 0.14-0.16.
* **mlp. gate:** Displays a pattern of increasing contribution from lower layers to higher layers, peaking around 0.17-0.18 in the highest layers.
Specifically, approximate values (with uncertainty of +/- 0.02):
| Component | Layer 0 | Layer 4 | Layer 8 | Layer 12 | Layer 16 | Layer 20 | Layer 24 | Layer 27 |
|---|---|---|---|---|---|---|---|---|
| attn. q | 0.14 | 0.15 | 0.16 | 0.15 | 0.16 | 0.17 | 0.17 | 0.17 |
| attn. k | 0.18 | 0.17 | 0.16 | 0.14 | 0.13 | 0.13 | 0.13 | 0.14 |
| attn. v | 0.17 | 0.16 | 0.15 | 0.13 | 0.12 | 0.13 | 0.13 | 0.14 |
| attn. o | 0.12 | 0.13 | 0.14 | 0.15 | 0.16 | 0.17 | 0.17 | 0.18 |
| mlp. up | 0.14 | 0.15 | 0.15 | 0.15 | 0.16 | 0.16 | 0.16 | 0.16 |
| mlp. down | 0.14 | 0.15 | 0.15 | 0.15 | 0.16 | 0.16 | 0.16 | 0.16 |
| mlp. gate | 0.12 | 0.13 | 0.14 | 0.15 | 0.16 | 0.17 | 0.17 | 0.18 |
### Key Observations
* Attention Key (`attn. k`) and Attention Value (`attn. v`) components have the highest contributions in the initial layers, suggesting their importance in early stages of processing.
* Attention Output (`attn. o`) and MLP Gate (`mlp. gate`) components show increasing contributions in higher layers, indicating their growing significance in later stages.
* MLP Up-projection (`mlp. up`) and MLP Down-projection (`mlp. down`) maintain relatively consistent contributions across all layers.
* The heatmap reveals a shift in contribution from attention mechanisms in lower layers to MLP components in higher layers.
### Interpretation
This heatmap likely represents the contribution of different components within a deep learning model, potentially a Transformer-based architecture, across its layers. The data suggests that the initial layers rely heavily on attention mechanisms (specifically the Key and Value components) to extract and process input features. As the data flows through the network, the role of attention mechanisms shifts towards the Output component, while MLP components (particularly the Gate) become increasingly important for higher-level feature transformations and decision-making.
The consistent contribution of MLP Up and Down projections suggests their role in maintaining a stable feature representation throughout the network. The shift in contribution patterns could indicate that the model learns to initially focus on identifying relevant input features using attention, and then utilizes MLP layers to refine and integrate these features for final predictions. The heatmap provides valuable insights into the internal workings of the model and can be used to guide architectural modifications or optimization strategies.