## Heatmap: Attention and MLP Component Values Across Layers
### Overview
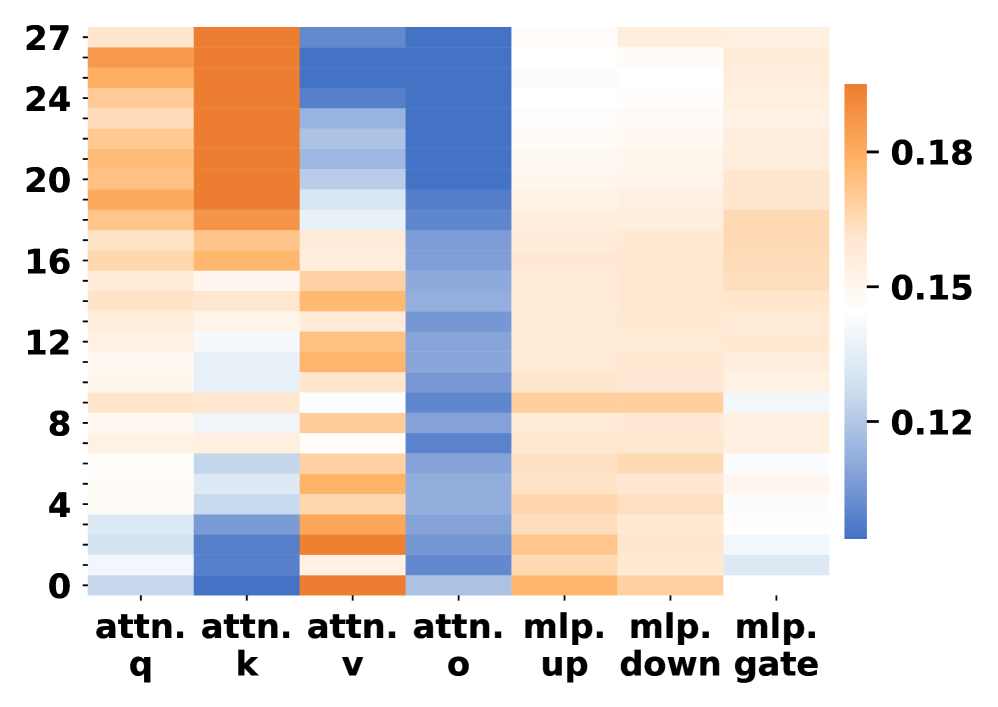
The image is a heatmap visualizing numerical values across 28 layers (rows 0–27) for attention mechanisms (q, k, v, o) and MLP components (up, down, gate). Values range from 0.12 (blue) to 0.18 (orange), with a color gradient indicating magnitude.
### Components/Axes
- **X-axis (Columns)**:
- `attn. q`, `attn. k`, `attn. v`, `attn. o` (attention mechanisms)
- `mlp. up`, `mlp. down`, `mlp. gate` (MLP components)
- **Y-axis (Rows)**: Layer indices 0–27 (numerical scale).
- **Legend**: Colorbar on the right, mapping values to colors (blue = 0.12, orange = 0.18).
### Detailed Analysis
1. **Attention Mechanisms**:
- **`attn. q`**: Highest values (dark orange) in rows 24–27 (~0.17–0.18), decreasing to ~0.12 in rows 0–4.
- **`attn. k`**: Similar trend to `attn. q`, with peaks in rows 24–27 (~0.16–0.17) and lower values (~0.12–0.14) in rows 0–12.
- **`attn. v`**: Lower values (~0.12–0.14) across all rows, with minimal variation.
- **`attn. o`**: Consistently low (~0.12–0.13) across all layers.
2. **MLP Components**:
- **`mlp. up`**: Moderate values (~0.14–0.16) in rows 8–20, peaking at ~0.17 in rows 24–27.
- **`mlp. down`**: Slightly lower than `mlp. up`, with values ~0.13–0.15.
- **`mlp. gate`**: Lowest values (~0.12–0.14) across all layers.
### Key Observations
- **High Attention in Upper Layers**: `attn. q` and `attn. k` show strong values in the top 4 layers (24–27), suggesting increased focus in later processing stages.
- **Stable MLP Values**: MLP components exhibit less variation, with `mlp. gate` consistently the lowest.
- **Color Consistency**: All orange regions align with the legend’s high-value range (0.15–0.18), confirming accurate color mapping.
### Interpretation
The heatmap likely represents attention weights or activation magnitudes in a transformer-based model. The dominance of `attn. q` and `attn. k` in upper layers implies these mechanisms play a critical role in later-stage information processing. The MLP components, while present, show weaker signals, indicating their role may be more stable or secondary. The lack of extreme outliers suggests a balanced distribution of attention and MLP contributions across layers.