## Chart: Total Log-Likelihood vs. Text Length by Source
### Overview
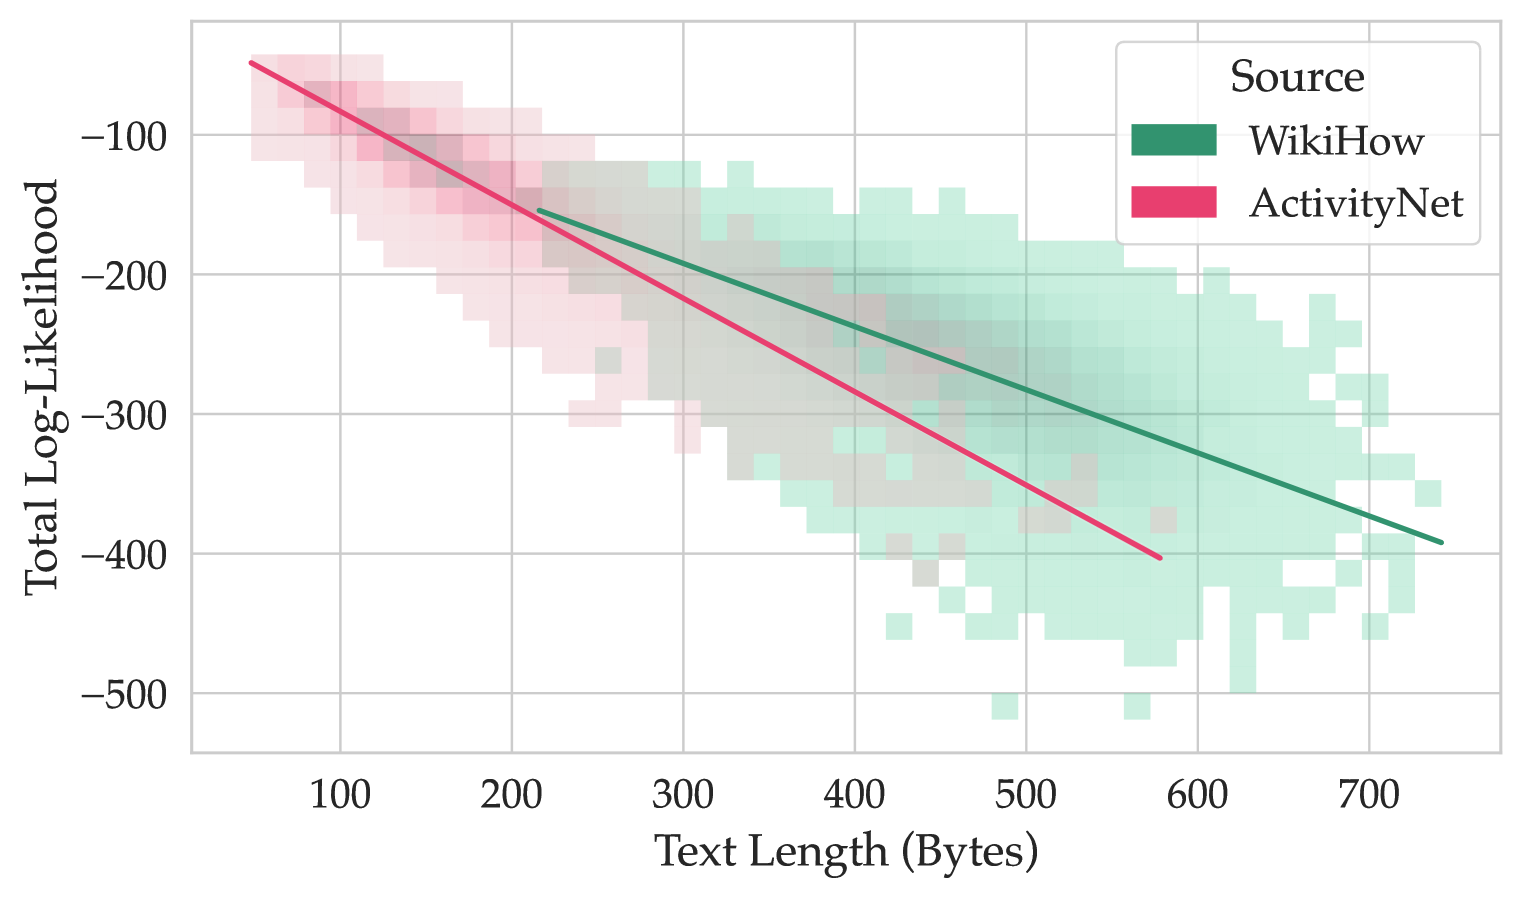
The image is a scatter plot showing the relationship between "Total Log-Likelihood" and "Text Length (Bytes)" for two sources: WikiHow and ActivityNet. The plot includes density heatmaps for each source and trend lines.
### Components/Axes
* **X-axis:** Text Length (Bytes), ranging from 0 to 700, with markers at 100, 200, 300, 400, 500, 600, and 700.
* **Y-axis:** Total Log-Likelihood, ranging from -500 to -100, with markers at -500, -400, -300, -200, and -100.
* **Legend (Top-Right):**
* WikiHow (Green)
* ActivityNet (Red)
* **Data:**
* WikiHow: Represented by a green density heatmap and a green trend line.
* ActivityNet: Represented by a red density heatmap and a red trend line.
### Detailed Analysis
* **WikiHow (Green):**
* **Trend:** The green trend line slopes downward, indicating a negative correlation between text length and total log-likelihood.
* **Data Points (Approximate):**
* At Text Length = 100, Total Log-Likelihood ≈ -150
* At Text Length = 700, Total Log-Likelihood ≈ -400
* **Density Heatmap:** The green heatmap shows a higher concentration of data points between Text Length 300-500 and Total Log-Likelihood -200 to -350.
* **ActivityNet (Red):**
* **Trend:** The red trend line slopes downward, indicating a negative correlation between text length and total log-likelihood.
* **Data Points (Approximate):**
* At Text Length = 100, Total Log-Likelihood ≈ -80
* At Text Length = 600, Total Log-Likelihood ≈ -400
* **Density Heatmap:** The red heatmap shows a higher concentration of data points between Text Length 100-300 and Total Log-Likelihood -100 to -250.
### Key Observations
* Both WikiHow and ActivityNet show a negative correlation between text length and total log-likelihood.
* ActivityNet tends to have higher log-likelihood values for shorter text lengths compared to WikiHow.
* The density heatmaps indicate that WikiHow has a higher concentration of data points at longer text lengths, while ActivityNet has a higher concentration at shorter text lengths.
### Interpretation
The data suggests that as text length increases, the total log-likelihood decreases for both WikiHow and ActivityNet. This could indicate that longer texts are more complex or contain more noise, leading to lower log-likelihood scores. The difference in log-likelihood values between the two sources at shorter text lengths may reflect differences in the content or writing style of WikiHow and ActivityNet. The heatmaps highlight the typical text length ranges for each source, with WikiHow generally having longer texts than ActivityNet.