\n
## Scatter Plot with Regression Lines: Text Length vs. Total Log-Likelihood by Source
### Overview
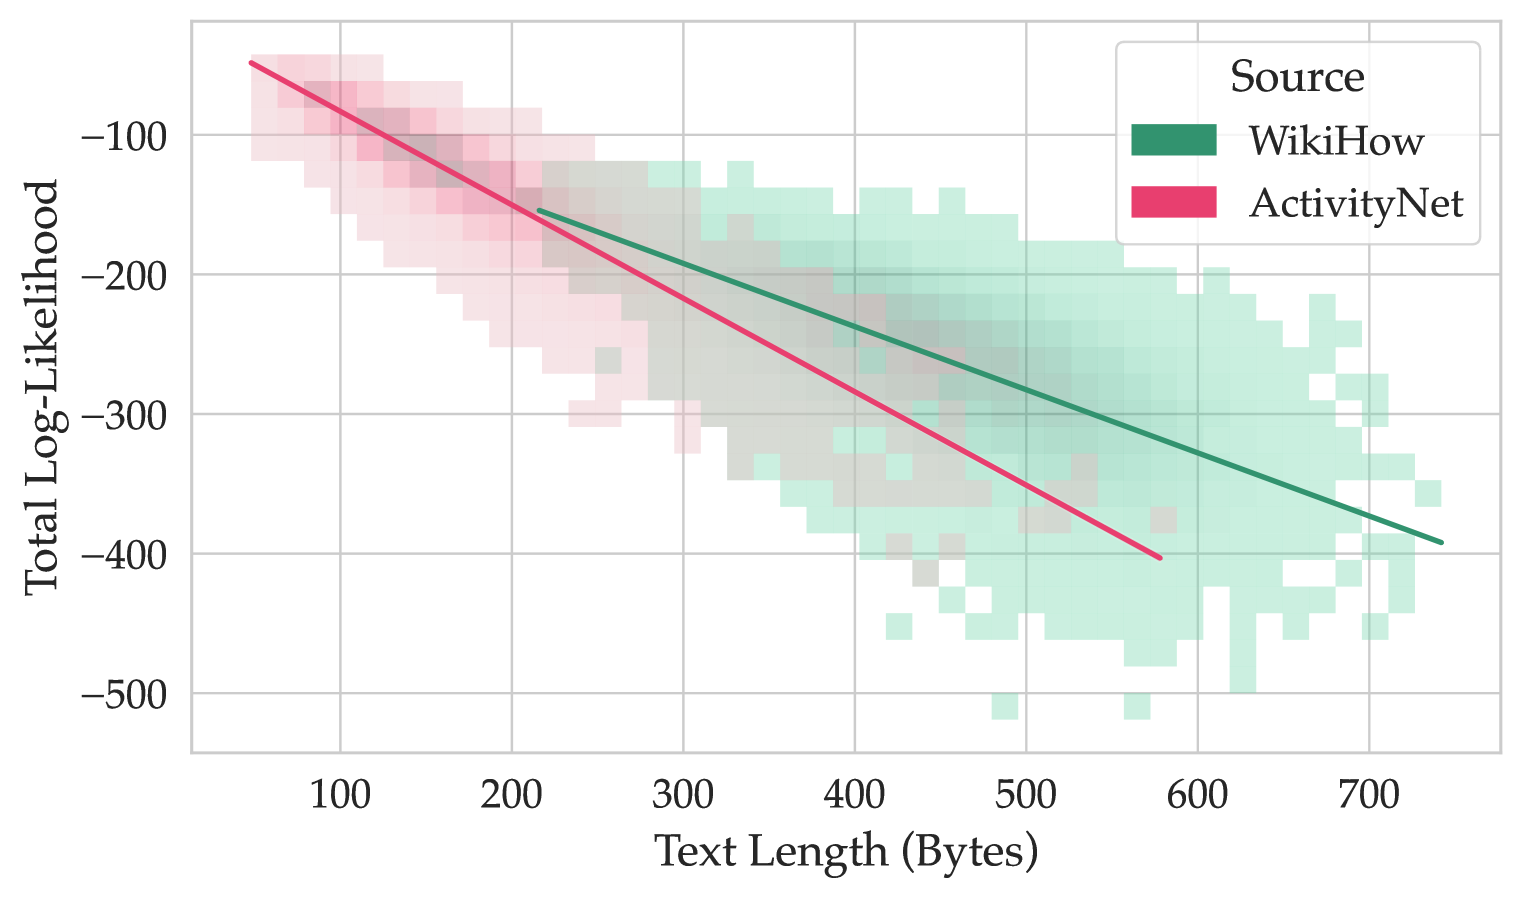
This image is a scatter plot with overlaid regression lines, visualizing the relationship between the length of text (in bytes) and its total log-likelihood for two distinct data sources: WikiHow and ActivityNet. The plot suggests a negative correlation between text length and log-likelihood for both sources.
### Components/Axes
* **X-Axis:** Labeled "Text Length (Bytes)". The scale runs from approximately 50 to 750 bytes, with major tick marks at 100, 200, 300, 400, 500, 600, and 700.
* **Y-Axis:** Labeled "Total Log-Likelihood". The scale runs from approximately -50 to -500, with major tick marks at -100, -200, -300, -400, and -500.
* **Legend:** Located in the top-right corner of the plot area. It is titled "Source" and contains two entries:
* A green square labeled "WikiHow".
* A pink square labeled "ActivityNet".
* **Data Series:** Two distinct series are plotted as semi-transparent, binned scatter points (resembling a 2D histogram or density plot) with solid regression lines.
* **WikiHow (Green):** Data points are represented by green squares. A solid green regression line is overlaid.
* **ActivityNet (Pink):** Data points are represented by pink squares. A solid pink regression line is overlaid.
### Detailed Analysis
**1. WikiHow Data Series (Green):**
* **Trend Verification:** The green regression line slopes downward from left to right, indicating a negative correlation. As text length increases, total log-likelihood decreases.
* **Data Distribution:** The green data points are densely clustered in a broad band. They span a text length range from approximately 200 bytes to 750 bytes. The corresponding log-likelihood values range from about -100 down to -500.
* **Regression Line Points (Approximate):**
* Start: (Text Length ≈ 200 bytes, Log-Likelihood ≈ -150)
* End: (Text Length ≈ 750 bytes, Log-Likelihood ≈ -400)
**2. ActivityNet Data Series (Pink):**
* **Trend Verification:** The pink regression line also slopes downward from left to right, indicating a negative correlation. Its slope appears steeper than the WikiHow line.
* **Data Distribution:** The pink data points are concentrated in a band that starts at shorter text lengths. They span from approximately 50 bytes to 600 bytes. The log-likelihood values range from about -50 down to -400.
* **Regression Line Points (Approximate):**
* Start: (Text Length ≈ 50 bytes, Log-Likelihood ≈ -50)
* End: (Text Length ≈ 600 bytes, Log-Likelihood ≈ -400)
**3. Relationship Between Series:**
* The two data clouds overlap significantly in the region between 200-600 bytes and -150 to -400 log-likelihood.
* The ActivityNet series (pink) dominates the shorter text length region (<200 bytes), while the WikiHow series (green) extends into the longer text length region (>600 bytes).
* The pink regression line (ActivityNet) is consistently below the green regression line (WikiHow) for text lengths where both are present, suggesting that for a given text length, ActivityNet texts tend to have a lower total log-likelihood than WikiHow texts.
### Key Observations
1. **Strong Negative Correlation:** Both datasets exhibit a clear, strong negative linear relationship between text length and total log-likelihood.
2. **Differing Slopes:** The rate of decrease in log-likelihood per additional byte of text is greater for ActivityNet (steeper pink line) than for WikiHow (shallower green line).
3. **Domain Separation:** The sources occupy partially distinct domains in the feature space. ActivityNet is associated with shorter texts and a wider initial range of log-likelihoods. WikiHow is associated with longer texts.
4. **Convergence at Length:** The two regression lines appear to converge near a log-likelihood of -400 at the upper end of the ActivityNet text length range (~600 bytes).
### Interpretation
This chart likely analyzes the performance or characteristics of a probabilistic model (e.g., a language model) applied to text from two different datasets. Total log-likelihood is a measure of how well the model explains the data; higher values (closer to zero) indicate better fit.
* **Core Finding:** The model's confidence or explanatory power (log-likelihood) systematically decreases as the text it is evaluating gets longer. This is a common phenomenon, as longer sequences present more opportunities for deviation from model predictions.
* **Source-Specific Behavior:** The model assigns consistently higher likelihoods to WikiHow texts of a given length compared to ActivityNet texts. This could imply:
* The WikiHow domain (likely instructional, procedural text) is more predictable or better represented in the model's training data.
* The ActivityNet domain (likely descriptive, narrative text about activities) is more diverse or contains more complex language patterns that the model finds less probable.
* **Practical Implication:** When using this model for tasks like text generation, classification, or anomaly detection, one must account for the inherent bias against longer texts and the different baseline likelihoods for different text sources. A raw log-likelihood score is not directly comparable across texts of different lengths or from different domains without normalization.