## Diagram: Electrochemical Cell Ion Dynamics and Redox Reactions
### Overview
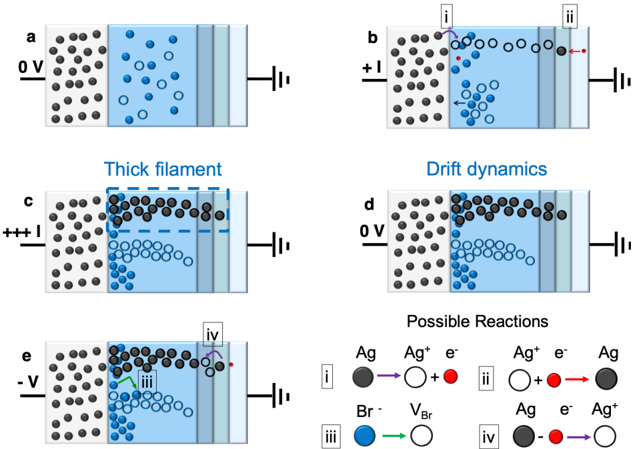
The image is a scientific diagram illustrating ion movement and redox reactions in an electrochemical cell. It consists of five panels (a–e) showing sequential states of ion distribution, a "Thick filament" annotation, "Drift dynamics" panel, and a "Possible Reactions" section with chemical equations. The diagram uses color-coded ions (black for Ag, blue for Br⁻, red for electrons) and directional arrows to depict processes.
---
### Components/Axes
1. **Panels a–e**:
- **a**: Initial state with 0V applied, showing uniform ion distribution.
- **b**: +I (current input) applied, initiating ion migration.
- **c**: "Thick filament" highlighted with a dashed blue box, showing concentrated ions.
- **d**: "Drift dynamics" panel with ions redistributing under 0V.
- **e**: -V (reverse voltage) applied, triggering reaction iii.
2. **Legend** (bottom-right):
- **i**: Ag → Ag⁺ + e⁻ (oxidation)
- **ii**: Ag⁺ + e⁻ → Ag (reduction)
- **iii**: Br⁻ → VBr (oxidation)
- **iv**: Ag + e⁻ → Ag⁺ (reduction)
3. **Voltage Labels**:
- 0V (panels a, d)
- +I (panel b)
- -V (panel e)
4. **Ion Colors**:
- Black: Ag (solid spheres)
- Blue: Br⁻ (open circles)
- Red: e⁻ (small red dots)
---
### Detailed Analysis
1. **Panel a**:
- Uniform distribution of black (Ag) and blue (Br⁻) ions.
- 0V applied; no current flow indicated.
2. **Panel b**:
- +I current input shown by red arrow.
- Br⁻ ions (blue) begin migrating toward the right electrode.
3. **Panel c**:
- "Thick filament" region (dashed blue box) shows concentrated Ag⁺ ions (black).
- Br⁻ ions (blue) accumulate near the left electrode.
4. **Panel d**:
- Drift dynamics under 0V: Ag⁺ ions (black) diffuse toward the right, Br⁻ ions (blue) toward the left.
5. **Panel e**:
- -V applied, reversing ion flow.
- Reaction iii (Br⁻ → VBr) occurs at the left electrode (green arrow).
- Reaction iv (Ag + e⁻ → Ag⁺) occurs at the right electrode (purple arrow).
---
### Key Observations
1. **Ion Migration**:
- Br⁻ ions (blue) consistently move toward the anode (left electrode) under +I and -V.
- Ag⁺ ions (black) migrate toward the cathode (right electrode) during drift dynamics.
2. **Reaction Correlation**:
- Reaction i (oxidation of Ag) and reaction ii (reduction of Ag⁺) are linked to Ag ion movement.
- Reaction iii (oxidation of Br⁻) is tied to the "Thick filament" region.
3. **Voltage Effects**:
- +I drives Br⁻ oxidation; -V reverses ion flow and triggers reaction iii.
---
### Interpretation
The diagram models an electrochemical cell where:
- **Ag** acts as both anode and cathode, undergoing oxidation (i) and reduction (ii).
- **Br⁻** is oxidized at the anode (reaction iii), forming VBr, suggesting a bromine-based electrolyte.
- The "Thick filament" in panel c likely represents a structural change (e.g., electrode degradation or ion clustering) under high current.
- Drift dynamics (panel d) illustrate ion redistribution under equilibrium conditions (0V), critical for understanding cell stability.
**Notable Insights**:
- The dual role of Ag as both oxidizing and reducing agent highlights its catalytic potential.
- Reaction iii (Br⁻ → VBr) implies a bromine-based redox couple, which could influence cell voltage and efficiency.
- The "Thick filament" annotation suggests a focus on material science aspects, such as electrode morphology changes during operation.
This diagram emphasizes the interplay between ion dynamics, voltage application, and redox chemistry in electrochemical systems, with potential applications in battery design or corrosion studies.