## Bipartite Graph: A to P
### Overview
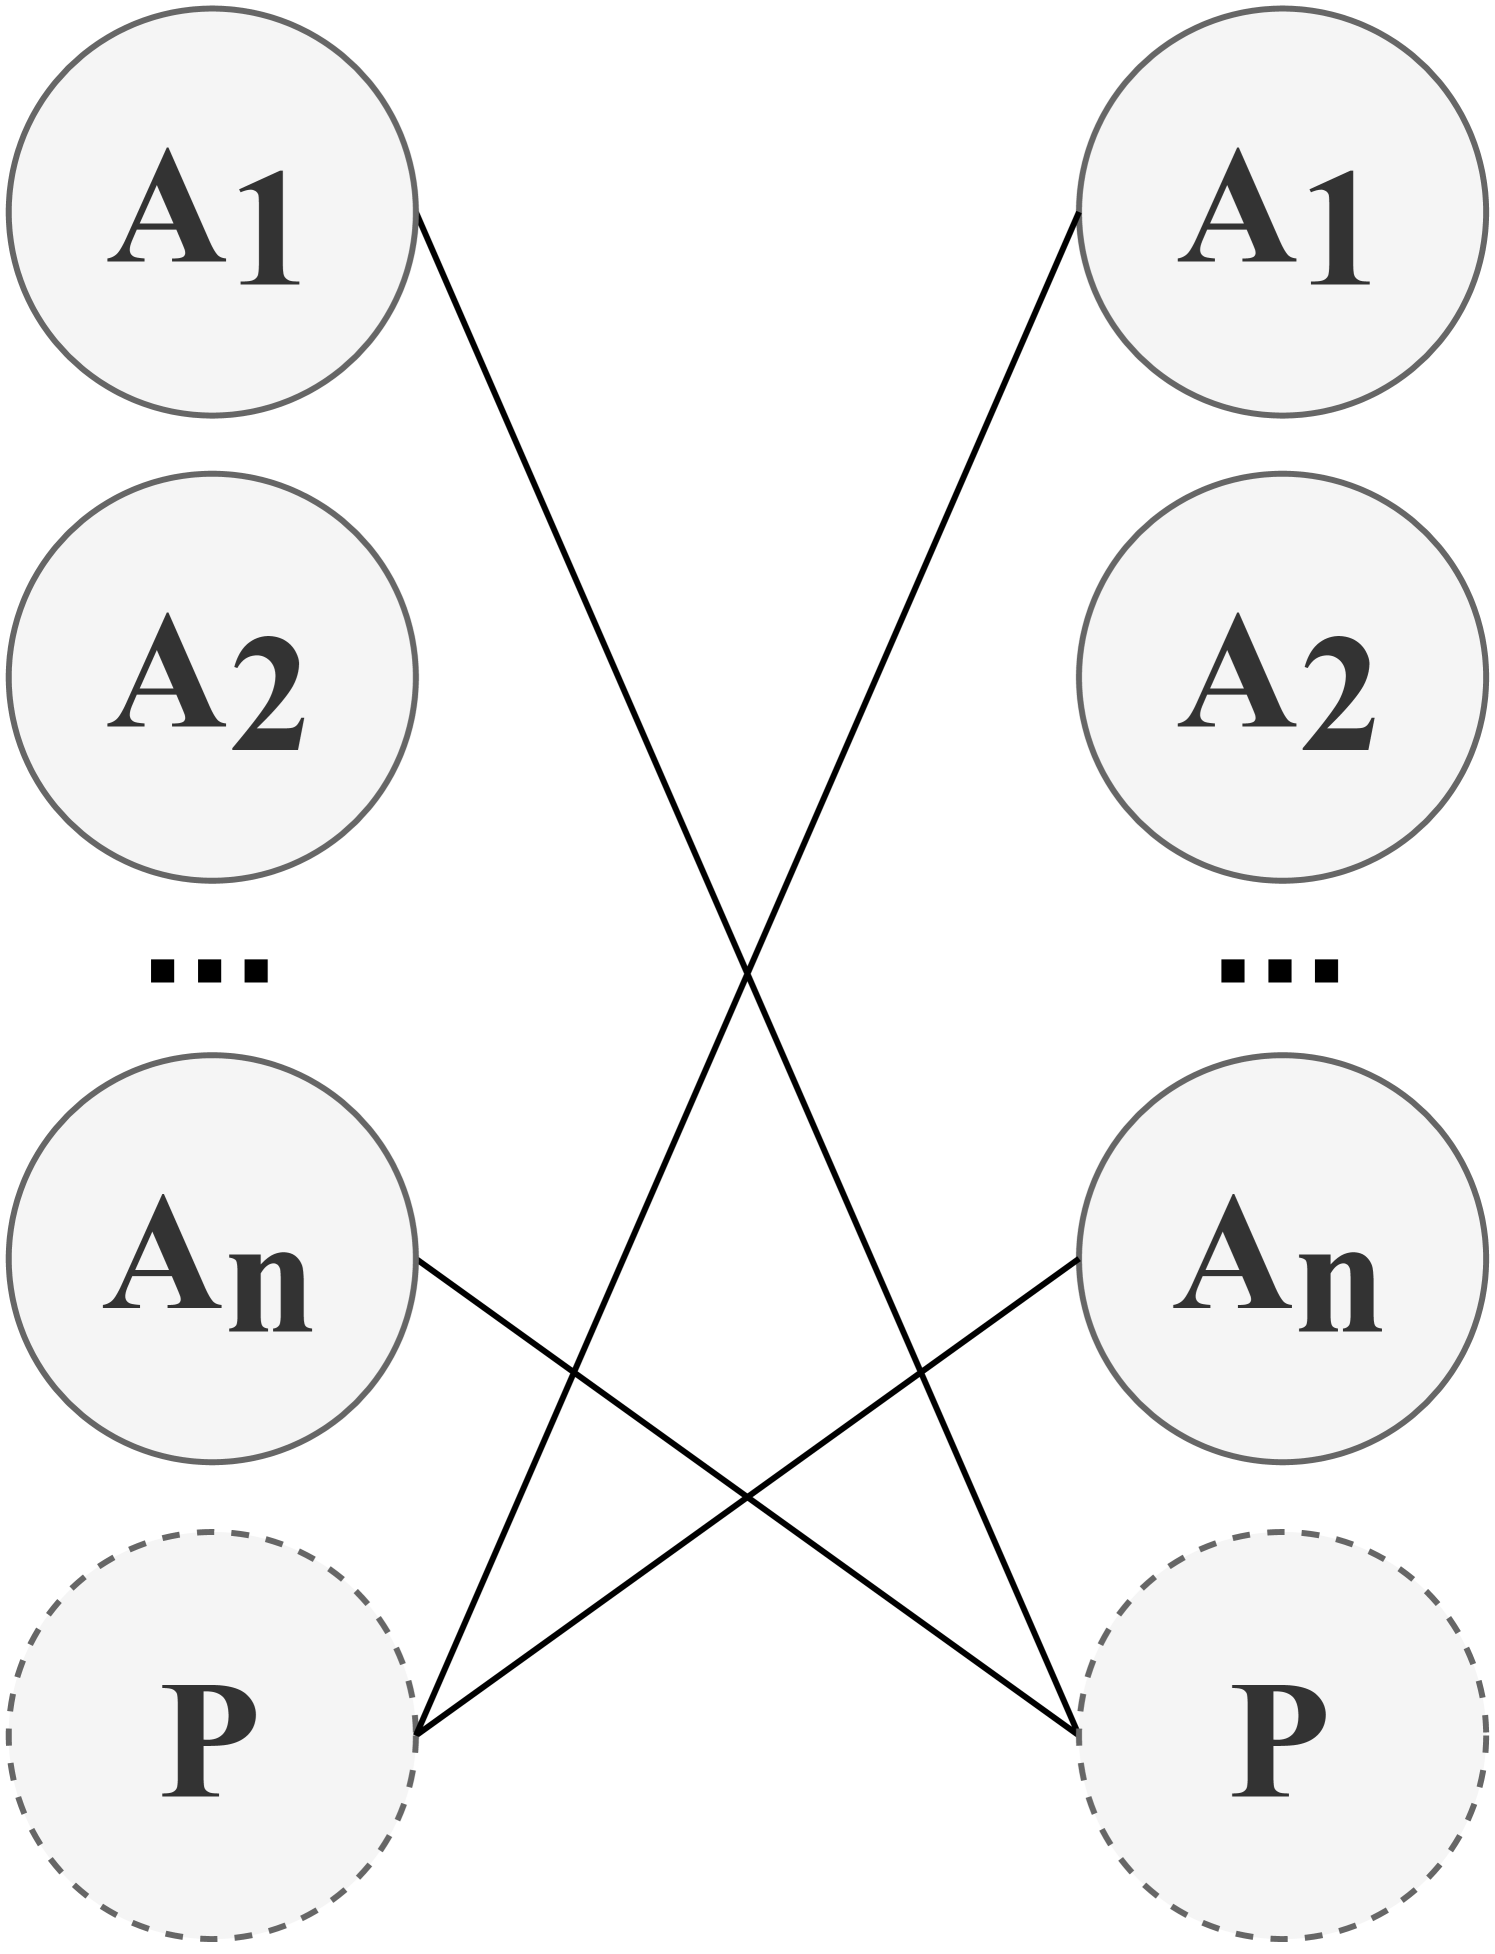
The image depicts a bipartite graph showing connections between two sets of nodes, labeled 'A' and 'P'. The 'A' set consists of nodes A1, A2, ..., An, while the 'P' set consists of two nodes labeled 'P'. The connections between the 'A' and 'P' nodes are represented by black lines.
### Components/Axes
* **Nodes:**
* Left Side: A1, A2, ..., An, P (dashed outline)
* Right Side: A1, A2, ..., An, P (dashed outline)
* **Edges:** Black lines connecting nodes from the left side to the right side.
### Detailed Analysis
* **Left Side Nodes:**
* A1: Top-most node, solid outline.
* A2: Second node from the top, solid outline.
* ...: Ellipsis indicating a continuation of the pattern.
* An: Second node from the bottom, solid outline.
* P: Bottom-most node, dashed outline.
* **Right Side Nodes:**
* A1: Top-most node, solid outline.
* A2: Second node from the top, solid outline.
* ...: Ellipsis indicating a continuation of the pattern.
* An: Second node from the bottom, solid outline.
* P: Bottom-most node, dashed outline.
* **Connections:**
* A1 (left) is connected to An (right) and P (right).
* An (left) is connected to A1 (right) and P (right).
### Key Observations
* The graph represents a bipartite structure, where connections exist between the 'A' and 'P' sets but not within the sets themselves.
* The 'P' nodes have dashed outlines, potentially indicating a different status or characteristic compared to the 'A' nodes.
* The ellipsis (...) suggests that there are potentially many 'A' nodes in the graph.
* The connections are not one-to-one; A1 and An on the left both connect to P on the right.
### Interpretation
The diagram illustrates a bipartite graph, a common structure in computer science and mathematics used to model relationships between two distinct sets of objects. The 'A' nodes could represent attributes or features, while the 'P' nodes could represent properties or outcomes. The dashed outline of the 'P' nodes might indicate that they are predictions or potential states, as opposed to the definite 'A' nodes. The connections show how specific attributes (A1, An) influence or are related to certain properties (P). The ellipsis implies that this is a general representation that can be scaled to include more attributes.