\n
## Diagram: Bipartite Graph Representation
### Overview
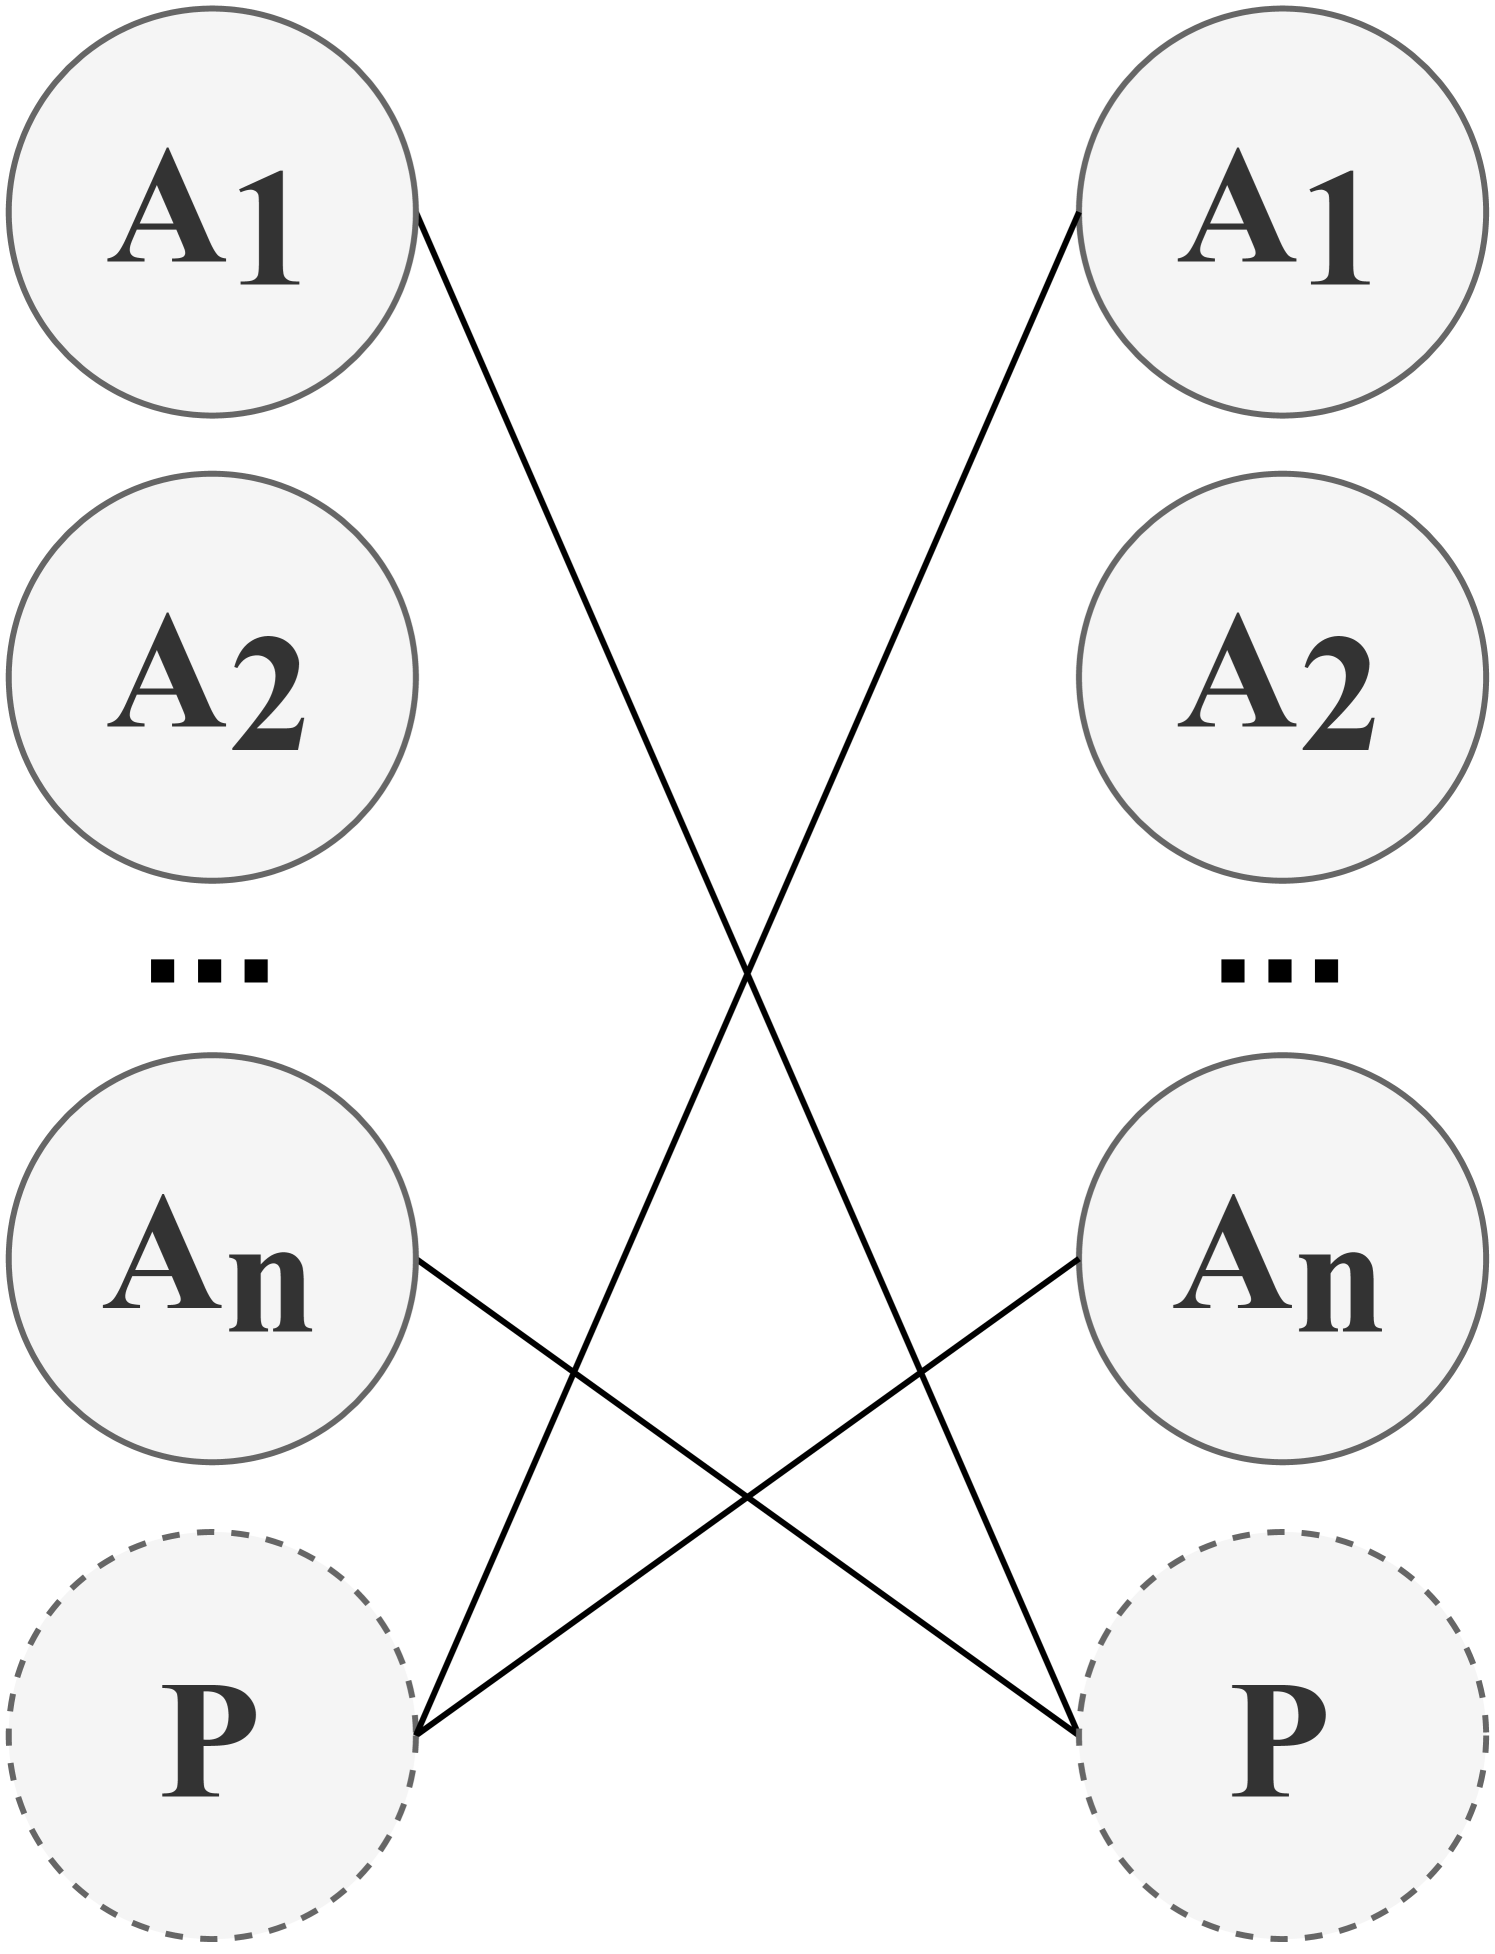
The image depicts a bipartite graph. It shows two distinct sets of nodes, labeled 'A1' through 'An' on the left and 'A1' through 'An' on the right, connected by lines. There are also two nodes labeled 'P' at the bottom, enclosed in dashed circles. The diagram illustrates a relationship between the 'A' nodes and the 'P' nodes.
### Components/Axes
The diagram consists of:
* **Nodes:** Circular nodes labeled A1, A2, and An (representing a sequence of nodes).
* **Nodes:** Circular nodes labeled A1, A2, and An (representing a sequence of nodes).
* **Nodes:** Circular nodes labeled P, enclosed in dashed circles.
* **Edges:** Straight lines connecting nodes from the left set (A1-An) to the right set (A1-An) and to the 'P' nodes.
* **Dashed Circles:** Enclosing the 'P' nodes.
### Detailed Analysis or Content Details
The diagram shows a bipartite graph structure. The left side contains nodes labeled A1, A2, and then "..." indicating a continuation to An. The right side mirrors this structure with nodes A1, A2, and "..." to An. Each node on the left side (A1, A2, An) is connected by a straight line to its corresponding node on the right side (A1, A2, An). Additionally, each node on the left side (A1, A2, An) is connected by a straight line to both 'P' nodes at the bottom. The 'P' nodes are enclosed in dashed circles.
The connections appear to be one-to-one between the A nodes on the left and right, and one-to-many between the A nodes on the left and the P nodes.
### Key Observations
* The diagram is symmetrical across a vertical axis.
* The 'P' nodes are visually distinguished by the dashed circles, suggesting a special role or grouping.
* The "..." notation indicates that the number of 'A' nodes is not limited to just two.
* The lines connecting the 'A' nodes to the 'P' nodes are not parallel, indicating a potential non-uniform relationship.
### Interpretation
This diagram likely represents a relationship between two distinct sets of entities. The 'A' nodes could represent attributes or features, while the 'P' nodes could represent instances or objects. The lines indicate associations or mappings between these entities. The bipartite nature suggests that an entity from the 'A' set is related to an entity from the 'P' set, but not directly to other entities within the same set.
The dashed circles around the 'P' nodes might indicate that they form a group or category. The connections from each 'A' node to both 'P' nodes suggest that each attribute or feature can be associated with multiple instances. The diagram could be used to model a many-to-many relationship between attributes and instances.
The diagram is abstract and doesn't provide specific data or values. It's a visual representation of a structural relationship, rather than a quantitative analysis. It could be a simplified model of a complex system, such as a database schema, a network topology, or a classification scheme. The use of 'n' suggests a generalized model applicable to a variable number of 'A' nodes.