## Chart/Diagram Type: Multiple Line Graphs and Schematics
### Overview
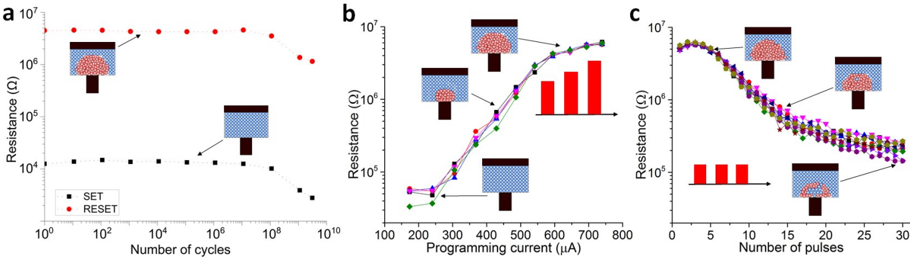
The image presents three line graphs (a, b, c) showing the resistance of a device under different conditions. Each graph is accompanied by schematic diagrams illustrating the device's state.
### Components/Axes
**Graph a:**
* **X-axis:** Number of cycles (logarithmic scale from 10^0 to 10^10)
* **Y-axis:** Resistance (Ω) (logarithmic scale from 10^4 to 10^7)
* **Legend:**
* SET (black squares)
* RESET (red circles)
* **Schematics:** Two schematics are present, one showing a high-resistance state (RESET) and the other showing a low-resistance state (SET).
**Graph b:**
* **X-axis:** Programming current (µA) (linear scale from 100 to 800)
* **Y-axis:** Resistance (Ω) (logarithmic scale from 10^4 to 10^7)
* **Data Series:** Multiple overlapping lines, distinguished by color and marker shape (green diamonds, blue circles, black squares, pink triangles, purple inverted triangles).
* **Schematics:** Three schematics are present, showing the device's state at different programming currents. A bar graph is also present, showing increasing resistance with increasing current.
**Graph c:**
* **X-axis:** Number of pulses (linear scale from 0 to 30)
* **Y-axis:** Resistance (Ω) (logarithmic scale from 10^5 to 10^7)
* **Data Series:** Multiple overlapping lines, distinguished by color and marker shape (green diamonds, blue circles, black squares, pink triangles, purple inverted triangles).
* **Schematics:** Two schematics are present, showing the device's state after different numbers of pulses. A pulse diagram is also present, showing three pulses.
### Detailed Analysis or ### Content Details
**Graph a:**
* **SET (black squares):** The resistance remains relatively constant around 10^4 Ω across the entire range of cycles.
* **RESET (red circles):** The resistance remains relatively constant around 10^7 Ω across the entire range of cycles.
**Graph b:**
* All data series show a similar trend: a sharp increase in resistance as the programming current increases from 200 µA to 800 µA.
* At 200 µA, the resistance is approximately 2 * 10^4 Ω to 5 * 10^4 Ω.
* At 800 µA, the resistance is approximately 5 * 10^6 Ω to 8 * 10^6 Ω.
**Graph c:**
* All data series show a similar trend: a decrease in resistance as the number of pulses increases from 0 to 30.
* At 0 pulses, the resistance is approximately 5 * 10^6 Ω to 8 * 10^6 Ω.
* At 30 pulses, the resistance is approximately 1 * 10^5 Ω to 3 * 10^5 Ω.
### Key Observations
* **Graph a:** The device exhibits stable SET and RESET resistance values over a large number of cycles.
* **Graph b:** The programming current significantly affects the resistance of the device.
* **Graph c:** The number of pulses significantly affects the resistance of the device.
### Interpretation
The data suggests that the device is a resistive switching memory element. Graph a demonstrates the endurance of the device, showing that it can maintain its SET and RESET states over many cycles. Graph b shows that the resistance can be modulated by applying different programming currents. Graph c shows that the resistance can be modulated by applying different numbers of pulses. The schematics provide a visual representation of the device's state during these processes. The bar graph in (b) and the pulse diagram in (c) visually reinforce the trends observed in the line graphs.