\n
## Scatter Plots: Resistance vs. Cycling/Current/Pulses
### Overview
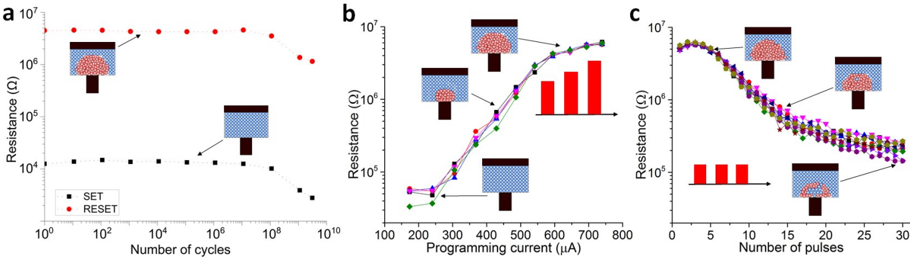
The image presents three scatter plots (labeled a, b, and c) illustrating the relationship between resistance and different parameters: number of cycles, programming current, and number of pulses, respectively. Each plot includes schematic diagrams of a device structure, likely a memristor or similar resistive switching element, positioned above the data. The plots appear to demonstrate the resistive switching behavior of the device.
### Components/Axes
**Plot a:**
* **X-axis:** Number of cycles (logarithmic scale, from 10⁰ to 10¹⁰) labeled "Number of cycles".
* **Y-axis:** Resistance (logarithmic scale, from 10³ to 10⁷ Ω) labeled "Resistance (Ω)".
* **Data Series:** Two distinct data series, labeled "SET" (red circles) and "RESET" (black circles) in the top-left corner.
**Plot b:**
* **X-axis:** Programming current (linear scale, from 100 to 800 μA) labeled "Programming current (µA)".
* **Y-axis:** Resistance (logarithmic scale, from 10⁴ to 10⁷ Ω) labeled "Resistance (Ω)".
* **Data Series:** Three data series, represented by red triangles, green circles, and purple squares.
**Plot c:**
* **X-axis:** Number of pulses (linear scale, from 0 to 30) labeled "Number of pulses".
* **Y-axis:** Resistance (logarithmic scale, from 10⁴ to 10⁷ Ω) labeled "Resistance (Ω)".
* **Data Series:** Four data series, represented by red triangles, green circles, purple squares, and magenta diamonds.
All plots share a similar schematic diagram at the top, depicting a layered device structure. The diagrams include red and black rectangular elements, and a blue patterned element.
### Detailed Analysis or Content Details
**Plot a:**
* The "SET" data series (red) shows a decreasing resistance with increasing number of cycles, starting at approximately 6 x 10⁶ Ω and decreasing to approximately 2 x 10⁵ Ω. The trend is generally downward, but with some fluctuations.
* The "RESET" data series (black) shows an increasing resistance with increasing number of cycles, starting at approximately 2 x 10⁴ Ω and increasing to approximately 8 x 10⁶ Ω. The trend is generally upward, but with some fluctuations.
**Plot b:**
* Red triangles: Resistance decreases from approximately 7 x 10⁶ Ω at 100 μA to approximately 2 x 10⁵ Ω at 600 μA, then plateaus.
* Green circles: Resistance decreases from approximately 6 x 10⁶ Ω at 100 μA to approximately 3 x 10⁵ Ω at 600 μA, then plateaus.
* Purple squares: Resistance decreases from approximately 7 x 10⁶ Ω at 100 μA to approximately 2 x 10⁵ Ω at 600 μA, then plateaus.
**Plot c:**
* Red triangles: Resistance decreases rapidly from approximately 6 x 10⁶ Ω at 0 pulses to approximately 2 x 10⁵ Ω at 15 pulses, then plateaus.
* Green circles: Resistance decreases rapidly from approximately 6 x 10⁶ Ω at 0 pulses to approximately 2 x 10⁵ Ω at 15 pulses, then plateaus.
* Purple squares: Resistance decreases rapidly from approximately 6 x 10⁶ Ω at 0 pulses to approximately 2 x 10⁵ Ω at 15 pulses, then plateaus.
* Magenta diamonds: Resistance decreases rapidly from approximately 6 x 10⁶ Ω at 0 pulses to approximately 2 x 10⁵ Ω at 15 pulses, then plateaus.
### Key Observations
* All three plots demonstrate a clear resistive switching behavior, where the resistance can be switched between high and low states.
* Plot a shows the endurance of the switching behavior over many cycles.
* Plot b shows the switching behavior as a function of the applied programming current.
* Plot c shows the switching behavior as a function of the number of applied pulses.
* The data series in plots b and c are very similar, suggesting that the switching behavior is consistent across different conditions or devices.
### Interpretation
The data suggests that the device exhibits reliable resistive switching characteristics. The plots demonstrate that the resistance can be controlled by varying the number of cycles, programming current, and number of pulses. The logarithmic scales on the Y-axes highlight the significant change in resistance between the high and low resistance states. The schematic diagrams indicate a layered structure, likely a memristive device. The consistency of the data series in plots b and c suggests that the switching mechanism is robust and repeatable. The plateaus observed in plots b and c indicate a saturation effect, where further increases in current or pulses do not result in significant changes in resistance. This data is likely used to characterize the performance of a novel memory or neuromorphic computing device.