## Line Graphs: Resistance vs. Cycles, Programming Current, and Pulses
### Overview
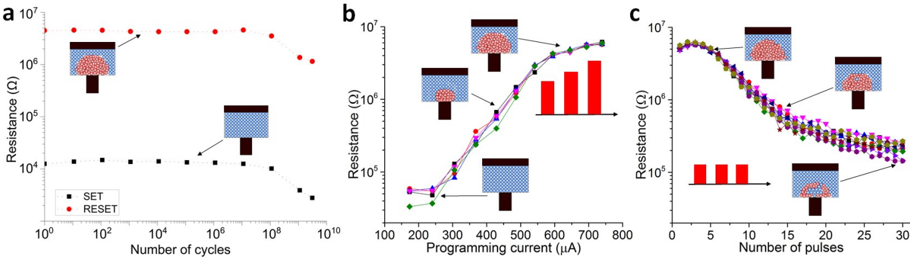
The image contains three line graphs (a, b, c) depicting resistance (Ω) as a function of different operational parameters: (a) number of cycles, (b) programming current (μA), and (c) number of pulses. Each graph includes insets illustrating a device structure with layered components (electrode, active layer, electrode) and red dots representing localized features. The graphs use logarithmic scales for resistance and linear scales for operational parameters.
---
### Components/Axes
#### Graph a: Resistance vs. Number of Cycles
- **X-axis**: Number of cycles (logarithmic scale: 10⁰ to 10¹⁰)
- **Y-axis**: Resistance (Ω) (logarithmic scale: 10⁴ to 10⁷)
- **Legend**:
- Black squares: "SET"
- Red dots: "RESET"
- **Insets**: Two device diagrams showing layered structures with red dots in the active layer.
#### Graph b: Resistance vs. Programming Current
- **X-axis**: Programming current (μA) (linear scale: 100 to 800)
- **Y-axis**: Resistance (Ω) (logarithmic scale: 10⁴ to 10⁷)
- **Legend**:
- Purple circles: "SET"
- Green squares: "RESET"
- Blue triangles: "RESET+SET"
- Red diamonds: "RESET+SET+RESET"
- **Insets**: Three device diagrams with red dots in the active layer.
#### Graph c: Resistance vs. Number of Pulses
- **X-axis**: Number of pulses (linear scale: 0 to 30)
- **Y-axis**: Resistance (Ω) (logarithmic scale: 10⁴ to 10⁷)
- **Legend**:
- Purple circles: "SET"
- Green squares: "RESET"
- Blue triangles: "RESET+SET"
- Red diamonds: "RESET+SET+RESET"
- **Insets**: Three device diagrams with red dots in the active layer.
---
### Detailed Analysis
#### Graph a: Resistance vs. Number of Cycles
- **SET (black squares)**: Resistance decreases from ~10⁶ Ω to ~10⁴ Ω over 10⁸ cycles. The trend is monotonic and gradual.
- **RESET (red dots)**: Resistance remains constant at ~10⁷ Ω across all cycles. No variation observed.
- **Key Data Points**:
- At 10² cycles: SET ≈ 10⁶ Ω, RESET ≈ 10⁷ Ω.
- At 10⁸ cycles: SET ≈ 10⁴ Ω, RESET ≈ 10⁷ Ω.
#### Graph b: Resistance vs. Programming Current
- **SET (purple circles)**: Resistance increases from ~10⁵ Ω to ~10⁶ Ω as current rises from 100 to 800 μA.
- **RESET (green squares)**: Resistance remains flat at ~10⁵ Ω regardless of current.
- **RESET+SET (blue triangles)**: Resistance increases from ~10⁵ Ω to ~10⁶ Ω, similar to SET but with a steeper slope.
- **RESET+SET+RESET (red diamonds)**: Resistance increases from ~10⁵ Ω to ~10⁶ Ω, with a plateau at higher currents.
- **Key Data Points**:
- At 100 μA: SET ≈ 10⁵ Ω, RESET ≈ 10⁵ Ω, RESET+SET ≈ 10⁵ Ω, RESET+SET+RESET ≈ 10⁵ Ω.
- At 800 μA: SET ≈ 10⁶ Ω, RESET ≈ 10⁵ Ω, RESET+SET ≈ 10⁶ Ω, RESET+SET+RESET ≈ 10⁶ Ω.
#### Graph c: Resistance vs. Number of Pulses
- **SET (purple circles)**: Resistance decreases from ~10⁶ Ω to ~10⁵ Ω over 30 pulses.
- **RESET (green squares)**: Resistance remains flat at ~10⁵ Ω.
- **RESET+SET (blue triangles)**: Resistance decreases from ~10⁶ Ω to ~10⁵ Ω, with a slower rate than SET.
- **RESET+SET+RESET (red diamonds)**: Resistance decreases from ~10⁶ Ω to ~10⁵ Ω, with a gradual decline.
- **Key Data Points**:
- At 0 pulses: SET ≈ 10⁶ Ω, RESET ≈ 10⁵ Ω, RESET+SET ≈ 10⁶ Ω, RESET+SET+RESET ≈ 10⁶ Ω.
- At 30 pulses: SET ≈ 10⁵ Ω, RESET ≈ 10⁵ Ω, RESET+SET ≈ 10⁵ Ω, RESET+SET+RESET ≈ 10⁵ Ω.
---
### Key Observations
1. **SET Operation**: Resistance decreases with cycles (graph a) and increases with programming current (graph b). In graph c, resistance decreases with pulses.
2. **RESET Operation**: Resistance remains constant across all parameters (graphs a, b, c).
3. **Combined Sequences**:
- "RESET+SET" and "RESET+SET+RESET" show intermediate resistance values between SET and RESET.
- Resistance trends for combined sequences are less pronounced than for individual operations.
4. **Device Structure**: Insets in all graphs show a layered device with red dots in the active layer, likely representing defects or active regions critical for resistance modulation.
---
### Interpretation
- **SET/RESET Dynamics**: The device exhibits non-volatile switching behavior, where resistance changes persist across cycles (graph a) and pulses (graph c). The SET operation reduces resistance, while RESET maintains it.
- **Current Dependence**: Resistance modulation is current-dependent (graph b), with higher currents inducing larger resistance changes. This suggests a threshold effect for SET/RESET operations.
- **Pulse Effects**: Repeated pulses (graph c) reduce resistance, indicating potential fatigue or stabilization of the active layer. The gradual decline suggests a memory effect or degradation mechanism.
- **Device Mechanism**: The red dots in the active layer (insets) may represent localized defects or phase-separated regions that govern resistance switching. Their distribution could influence the device's response to electrical stimuli.
The data collectively demonstrate a resistive switching memory device with tunable resistance via electrical programming, current, and pulse sequences. The interplay between SET/RESET operations and device structure highlights the importance of material composition and defect engineering for optimizing performance.