## Application Domains Diagram: Probabilistic Computing with p-bits
### Overview
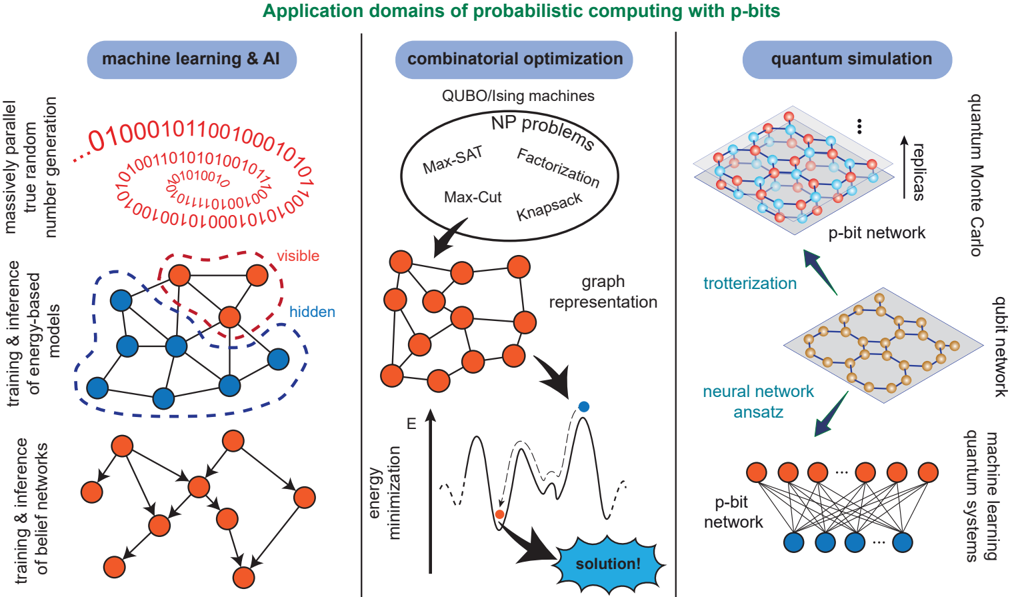
The image is a diagram illustrating the application domains of probabilistic computing using p-bits. It is divided into three main sections: machine learning & AI, combinatorial optimization, and quantum simulation. Each section depicts a specific application area with corresponding diagrams and labels.
### Components/Axes
* **Title:** Application domains of probabilistic computing with p-bits
* **Sections (Left to Right):**
* Machine Learning & AI
* Combinatorial Optimization
* Quantum Simulation
* **Labels within Sections:**
* **Machine Learning & AI:**
* massively parallel true random number generation
* training & inference of energy-based models
* training & inference of belief networks
* visible (red dashed line)
* hidden (blue dashed line)
* **Combinatorial Optimization:**
* QUBO/Ising machines
* NP problems
* Max-SAT
* Max-Cut
* Factorization
* Knapsack
* graph representation
* energy minimization (E)
* solution!
* **Quantum Simulation:**
* replicas
* p-bit network
* trotterization
* qubit network
* neural network ansatz
* p-bit network
* machine learning quantum systems
* quantum Monte Carlo
### Detailed Analysis
**Machine Learning & AI:**
* **Massively Parallel True Random Number Generation:** A sequence of 0s and 1s arranged in a circular pattern.
* **Training & Inference of Energy-Based Models:** A network of interconnected nodes, some colored red (inside a dashed red "visible" region) and some blue (inside a dashed blue "hidden" region).
* **Training & Inference of Belief Networks:** A directed graph with nodes and arrows indicating relationships.
**Combinatorial Optimization:**
* **QUBO/Ising Machines:** A collection of NP problems (Max-SAT, Max-Cut, Factorization, Knapsack) contained within an oval shape.
* **Graph Representation:** A network of interconnected nodes.
* **Energy Minimization:** A graph showing energy (E) on the vertical axis. A solid line represents the energy landscape, and a dashed line represents a possible path to a solution. A red dot indicates a local minimum, and a blue dot indicates the global minimum ("solution!").
**Quantum Simulation:**
* **Replicas:** Two layers of interconnected nodes, one above the other, representing replicas of a p-bit network.
* **Trotterization:** An arrow pointing from the p-bit network to a qubit network.
* **Neural Network Ansatz:** An arrow pointing from the qubit network to a p-bit network.
* **Machine Learning Quantum Systems:** A p-bit network connected to quantum systems.
### Key Observations
* The diagram illustrates three distinct application domains for probabilistic computing with p-bits.
* Each section uses different visual representations to depict the specific application.
* The "visible" and "hidden" labels in the Machine Learning & AI section suggest a distinction between observable and latent variables.
* The energy minimization graph in the Combinatorial Optimization section highlights the process of finding optimal solutions.
* The Quantum Simulation section shows the relationship between p-bit networks, qubit networks, and quantum systems.
### Interpretation
The diagram provides a high-level overview of how probabilistic computing with p-bits can be applied to various fields. It demonstrates the versatility of p-bits in addressing problems in machine learning, combinatorial optimization, and quantum simulation. The diagram suggests that p-bits can be used for tasks such as generating random numbers, training energy-based models, solving NP problems, and simulating quantum systems. The connections between different types of networks (p-bit, qubit) in the quantum simulation section indicate a potential for hybrid computing approaches. The diagram emphasizes the importance of energy minimization in finding solutions to complex problems.