## Diagram: Application Domains of Probabilistic Computing with p-bits
### Overview
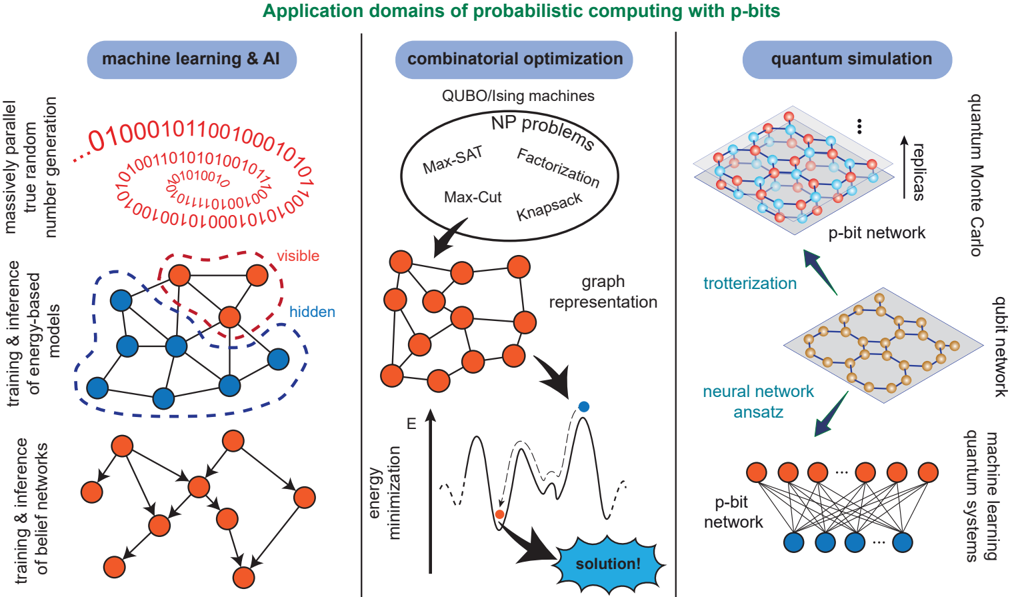
This image is a conceptual diagram illustrating three primary application domains for probabilistic computing using probabilistic bits (p-bits). The diagram is divided into three vertical columns, each dedicated to a specific domain: **machine learning & AI**, **combinatorial optimization**, and **quantum simulation**. Each column contains schematic representations, flow arrows, and textual labels explaining the processes and components involved.
### Components/Axes
The diagram is structured into three main vertical panels, each with a blue header at the top:
1. **Left Panel Header:** `machine learning & AI`
2. **Middle Panel Header:** `combinatorial optimization`
3. **Right Panel Header:** `quantum simulation`
The overall title at the top center is: `Application domains of probabilistic computing with p-bits`.
### Detailed Analysis
#### Left Panel: machine learning & AI
This panel contains three vertically stacked sub-sections:
1. **Top Section:**
* **Label (vertical text on left):** `massively parallel true random number generation`
* **Visual:** A spiral composed of red binary digits (`0` and `1`).
* **Transcribed Text (within spiral):** `...01000101100100010101...` (The sequence is continuous and spirals inward).
2. **Middle Section:**
* **Label (vertical text on left):** `training & inference of energy-based models`
* **Visual:** A network diagram with nodes and connecting lines.
* **Components:**
* Orange circles labeled `visible` (enclosed in a red dashed oval).
* Blue circles labeled `hidden` (enclosed in a blue dashed oval).
* Lines connect visible nodes to hidden nodes and other visible nodes.
3. **Bottom Section:**
* **Label (vertical text on left):** `training & inference of belief networks`
* **Visual:** A directed acyclic graph (belief network) with orange circles as nodes and arrows indicating dependencies.
#### Middle Panel: combinatorial optimization
This panel shows a flow from problem definition to solution:
1. **Top Section:**
* **Label:** `QUBO/Ising machines`
* **Visual:** An oval containing the text `NP problems` and a list of specific problems: `Max-SAT`, `Factorization`, `Max-Cut`, `Knapsack`.
2. **Middle Section:**
* **Label:** `graph representation`
* **Visual:** A graph with orange circles (nodes) connected by lines (edges). An arrow points from the `NP problems` oval to this graph.
3. **Bottom Section:**
* **Label (vertical axis):** `energy minimization` with an upward arrow labeled `E`.
* **Visual:** A plot showing a jagged energy landscape (solid black line) with a global minimum. A dashed gray line shows a path descending into this minimum.
* **Key Element:** A blue dot at the lowest point of the solid line, with an arrow pointing to a blue starburst shape containing the text `solution!`.
#### Right Panel: quantum simulation
This panel illustrates a flow between different computational representations:
1. **Top Section:**
* **Label (vertical text on right):** `quantum Monte Carlo`
* **Visual:** A 3D lattice structure labeled `p-bit network`. An upward arrow to its right is labeled `replicas`.
2. **Middle Section:**
* **Label:** `trotterization`
* **Visual:** A 2D lattice structure labeled `qubit network`. A blue arrow labeled `trotterization` points from the `p-bit network` above to this `qubit network`.
3. **Bottom Section:**
* **Label:** `neural network ansatz`
* **Visual:** A two-layer network. The top layer has orange circles, and the bottom layer has blue circles, with dense connections between them. This is labeled `p-bit network`.
* **Label (vertical text on right):** `machine learning of quantum systems`
* **Flow:** A blue arrow labeled `neural network ansatz` points from the `qubit network` above to this final `p-bit network`.
### Key Observations
* **Consistent Visual Language:** Orange circles consistently represent p-bits or visible units. Blue circles represent hidden units or qubits in different contexts.
* **Flow Indicators:** Arrows are used extensively to show process flow (e.g., from problem to graph to solution) or transformation between representations (e.g., trotterization).
* **Spatial Organization:** Each domain is clearly isolated in its own column, allowing for parallel comparison of how p-bits are applied in different fields.
* **Text Integration:** All explanatory text is embedded directly next to or within the relevant visual component, creating a self-contained explanatory diagram.
### Interpretation
This diagram serves as a high-level conceptual map, demonstrating the versatility of p-bits as a computational primitive across disparate fields. It suggests that the core capability of p-bits—efficiently sampling from probabilistic distributions—is a unifying theme.
* **In Machine Learning & AI,** p-bits are positioned as engines for generating true randomness and as the fundamental units in energy-based and belief network models, facilitating both training and inference.
* **In Combinatorial Optimization,** the diagram posits that NP-hard problems can be mapped onto graph representations solvable by energy minimization processes, with p-bit-based hardware (like QUBO/Ising machines) providing a physical substrate to find solutions.
* **In Quantum Simulation,** the diagram proposes a bridge between classical probabilistic computing and quantum systems. It illustrates how p-bit networks can emulate quantum Monte Carlo methods, connect to qubit networks via trotterization, and serve as neural network ansatzes for learning quantum system properties.
The overarching message is that p-bits offer a flexible, classical hardware-friendly framework for tackling problems traditionally associated with specialized AI hardware, optimization solvers, and even quantum computers. The diagram emphasizes transformation and mapping between different problem representations (e.g., NP problem → graph → energy landscape) as a key strategy enabled by this technology.