## Diagram: Application domains of probabilistic computing with p-bits
### Overview
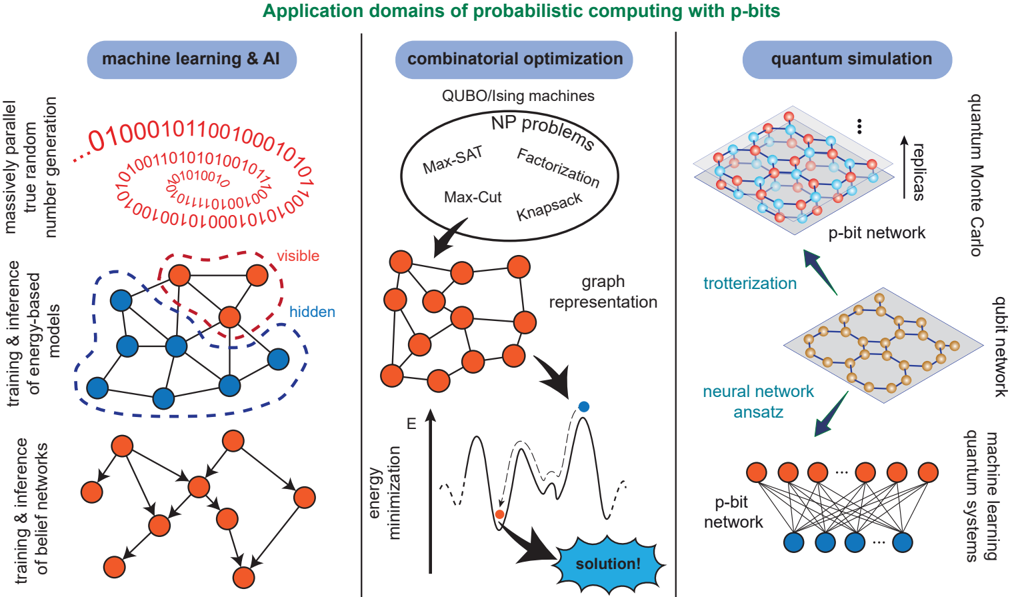
The diagram illustrates three application domains of probabilistic computing using p-bits: **machine learning & AI**, **combinatorial optimization**, and **quantum simulation**. Each domain is represented with network diagrams, flow arrows, and explanatory text.
---
### Components/Axes
#### Machine Learning & AI
- **Nodes**:
- Blue nodes labeled "visible" and "hidden" (dashed lines indicate connections).
- Orange nodes labeled "p-bit network."
- **Text**:
- "massively parallel true random number generation" (top-left).
- "training & inference of energy-based models" (left).
- "training & inference networks" (bottom-left, with arrows).
#### Combinatorial Optimization
- **Nodes**:
- Orange nodes forming a graph representation.
- **Text**:
- "QUBO/Ising machines" (top).
- NP problems: Max-SAT, Factorization, Max-Cut, Knapsack (inside an oval).
- "graph representation" (arrow from graph to energy minimization).
- Energy minimization graph (wavy line with "solution!" bubble).
#### Quantum Simulation
- **Nodes**:
- Red and blue nodes labeled "p-bit network" (top).
- Orange nodes labeled "quantum network" (middle).
- Blue nodes labeled "neural network ansatz" (bottom).
- **Text**:
- "quantum Monte Carlo" (right).
- "trotterization" (arrow from p-bit network to quantum network).
- "machine learning systems" (bottom-right).
---
### Detailed Analysis
#### Machine Learning & AI
- **Flow**:
- Blue "visible" and "hidden" nodes form a network, connected to orange "p-bit network" nodes.
- Arrows indicate training/inference processes.
- **Key Text**:
- "massively parallel true random number generation" suggests p-bits enable scalable randomness for training.
- "energy-based models" imply probabilistic inference frameworks.
#### Combinatorial Optimization
- **Flow**:
- Graph representation (orange nodes) maps to energy minimization (wavy line).
- Solution identified at the lowest energy point.
- **Key Text**:
- NP problems (Max-SAT, etc.) are solved via QUBO/Ising machines.
- Energy minimization graph shows a non-linear path to the solution.
#### Quantum Simulation
- **Flow**:
- P-bit network (red/blue nodes) undergoes "trotterization" to form a quantum network.
- Quantum network connects to "quantum Monte Carlo" and "machine learning systems."
- **Key Text**:
- "neural network ansatz" bridges quantum and classical ML.
---
### Key Observations
1. **Color Coding**:
- Blue nodes: Visible/hidden layers (machine learning).
- Orange nodes: P-bit networks (all domains).
- Red nodes: Quantum network (quantum simulation).
2. **Flow Direction**:
- Arrows indicate progression from p-bit networks to specialized systems (e.g., QUBO machines, quantum Monte Carlo).
3. **Missing Data**:
- No numerical values or scales provided (e.g., energy levels, node counts).
---
### Interpretation
The diagram positions p-bits as foundational elements for three advanced computing paradigms:
1. **Machine Learning**: P-bits enable energy-based models and parallel randomness, critical for training inference networks.
2. **Combinatorial Optimization**: P-bits map NP problems to energy landscapes, with QUBO/Ising machines finding solutions via minimization.
3. **Quantum Simulation**: P-bits simulate quantum systems through trotterization, linking to quantum Monte Carlo and hybrid quantum-classical ML.
The absence of numerical data suggests the diagram emphasizes conceptual relationships over quantitative metrics. The progression from p-bit networks to domain-specific systems highlights their versatility in addressing complex computational challenges.