## Chart: Magnitude and Phase Response
### Overview
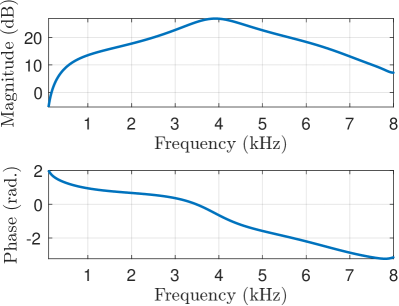
The image presents two plots: the top plot shows the magnitude response in decibels (dB) versus frequency in kilohertz (kHz), and the bottom plot shows the phase response in radians versus frequency in kilohertz (kHz). Both plots share the same x-axis (frequency).
### Components/Axes
**Top Plot (Magnitude Response):**
* **Y-axis:** Magnitude (dB), ranging from approximately 0 to 25 dB.
* **X-axis:** Frequency (kHz), ranging from 0 to 8 kHz.
* Axis markers: 1, 2, 3, 4, 5, 6, 7, 8
* **Data Series:** A single blue line representing the magnitude response.
**Bottom Plot (Phase Response):**
* **Y-axis:** Phase (rad.), ranging from -2 to 2 radians.
* **X-axis:** Frequency (kHz), ranging from 0 to 8 kHz.
* Axis markers: 1, 2, 3, 4, 5, 6, 7, 8
* **Data Series:** A single blue line representing the phase response.
### Detailed Analysis
**Top Plot (Magnitude Response):**
* The magnitude starts at approximately 0 dB at 0 kHz.
* The magnitude increases rapidly between 0 kHz and 1 kHz, reaching approximately 12 dB at 1 kHz.
* The magnitude continues to increase, but at a slower rate, reaching a peak of approximately 24 dB around 4 kHz.
* After 4 kHz, the magnitude decreases, reaching approximately 8 dB at 8 kHz.
**Bottom Plot (Phase Response):**
* The phase starts at approximately 2 radians at 0 kHz.
* The phase remains relatively constant between 0 kHz and 2 kHz, staying around 1 radian.
* The phase decreases between 2 kHz and 8 kHz, reaching approximately -3 radians at 8 kHz.
### Key Observations
* The magnitude response has a peak around 4 kHz, indicating a resonance or a filter effect at that frequency.
* The phase response is relatively flat at low frequencies and decreases at higher frequencies, indicating a delay or phase shift.
### Interpretation
The plots likely represent the frequency response of a system, such as an audio filter or an electronic circuit. The magnitude response shows how the system amplifies or attenuates different frequencies, while the phase response shows how the system shifts the phase of different frequencies. The peak in the magnitude response at 4 kHz suggests that the system has a resonant frequency at that point. The decreasing phase response indicates that the system introduces a delay that increases with frequency.